87 results
Statistics rubrics for GATE
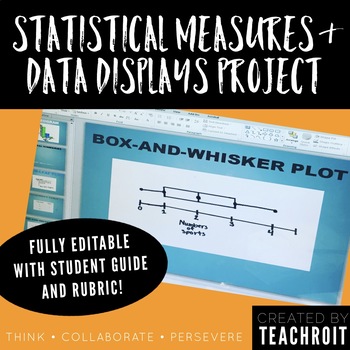
Statistics & Data Display Project for 6th Grade Math PBL (Fully Editable)
This product includes a student guide for a 6th grade middle school mathematics project that will require students to develop a statistical question, conduct a survey with their classmates, create numerical summaries, represent their findings using visual data displays, and finally present their findings! The thorough student guide provides step by step directions for each part of the project and could be used as either an in class project or to be assigned as homework. The student guide also in
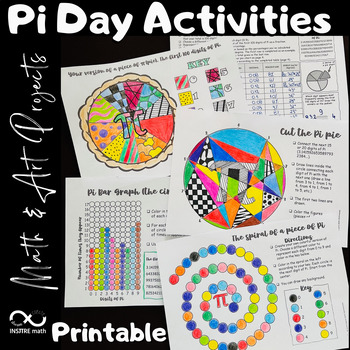
4 Pi Day Math Activities | Math & Art Projects | Coloring Circles | Pie Chart
4 Math & Art Projects to celebrate Pi Day that include circles and Pi exploration! Your students will love these Pi Day activities! Let your students express themselves using these hands-on Math & Art resources during the exploration of Pi.Content:- Your version of a piece of π (pie). The first 100 digits of Pi. Frequency Pie Chart.- Pi Bar Graph - the circular version.- The spiral of a piece of Pi.- Cut the Pi pie.This resource includes:- The editable PowerPoint™ version.- The printable
Subjects:
Grades:
4th - 8th
Math Enrichment Choice Board Sixth Grade for Ratios Statistics Number System
This resource includes math enrichment choice boards, rubrics, and instructions for every single 6th grade math Common Core State Standard for ratios, proportional relationships, expressions and equations, statistics and probability, geometry, and the number system. These are great for early finishers and students who need enrichment in math. Included in this pack are the math enrichment boards I use for my sixth grade learners who have mastered any of our math concepts and are now ready for a c

Football STEM Field Goal Challenge and History of Football and The Super Bowl
Super Bowl STEM Football Challenge! Looking for something to get your kids excited about learning during football season or during Super Bowl week. Engage your students with STEM Football Challenges, it also connects to Mike Lupic's book Million-Dollar Throw! STEM Football includes football terms, history of football, STEM Challenge, and a lap book that your students will love! The lap book is a great way for students to keep themselves accountable for their reading and to help them stay on
Subjects:
Grades:
3rd - 5th
Types:
NGSS:
3-5-ETS1-1
, 3-5-ETS1-2
Also included in: STEM Novel Connections and Activities
12 Days of Christmas: A Computer Spreadsheet Activity
This great holiday activity shows students how to use a computer spreadsheet to calculate the cost of their true love's gifts in today's dollars.The simple step-by-step procedure will allow both beginning and computer-savvy students to experience success as they learn how to use spreadsheet software. Students will enjoy the engaging and entertaining activity. No computer? No problem! Use the activity master so students can calculate the costs themselves.
Grades:
5th - 9th
Types:

Statistics Survey Project - Project Based Learning (PBL) with Math
Watch your students dive into the world of math as they create, execute, and analyze their own survey! Students will demonstrate mastery of data gathering, survey sampling, developing appropriate survey questions, data tables, Direct Variation, discrete graphs, dot plots, box and whisker graphs, and calculating the inter-quartile range.The Unique Survey Project is highly engaging, capitalizing on the innate curiosity of the adolescent mind. You will love the low-prep instructional guide. Your st
Subjects:
Grades:
6th - 10th
Types:
Also included in: Fun with Ratios Activities Bundle - 7th Grade PBL with Math
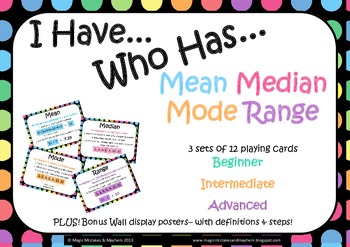
Mean, Median, Mode, Range "I Have Who Has" Game
A GREAT, FUN WAY FOR KIDS TO PRACTICE AND REINFORCE THEIR SKILLS IN THIS TRICKY TO REMEMBER AREA!3 DIFFERENT LEVELS! This pack includes 36 cards for the game "I Have Who Has" with a focus on Mean, Median, Mode and Range. The cards are split into three levels to be played in small groupsBeginner (green cards)Intermediate (orange cards)Advanced (purple cards)The aim of the game is to quickly work out the problem on your card so that when some one asks "who has...." if it is you then you can answe
Subjects:
Grades:
4th - 7th
What's the Verdict: Sharks vs. Lightning? Modes of Center, Spread, and More!
Put it to the test! Use the age-old expression: "You are more likely to get struck by lightning than to be bitten by a shark!" to learn and practice Measures of Center, Measures of Spread, Measures of Shape, and Statistical Graphing including:MEANMEDIANMODERANGEOUTLIERS [Using IQR +/- 1.5(IQR)]QUARTILES [lower quartile (IQ-1) and upper quartile (IQ-3)]INTERQUARTILE RANGE (IQR)MEAN ABSOLUTE DEVIATION/ M.A.D. ft. ABSOLUTE VALUESYMMETRY/ASYMMETRY OF DISTRIBUTIONCLUSTERS AND GAPSBELL SHAPED CURVE AN
Subjects:
Grades:
5th - 12th, Higher Education, Adult Education
Types:
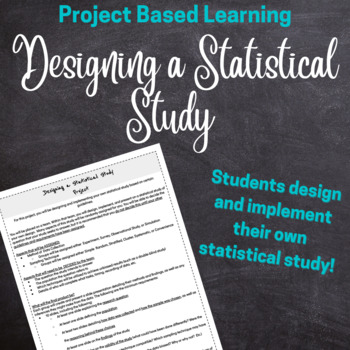
Statistics Project Design and Implement a Statistical Research Study Project
Prove that your students know how a good statistical or research study is designed! In this project, students will be assigned a method of data collection (either Observational Study, Experiment, Survey, or Simulation) and a sampling technique (either cluster, stratified, simple random, systemic, or convenience) and will design their own research question and study. The goal is for students to develop a research question that works well with the method of collection and sampling technique they w
Subjects:
Grades:
11th - 12th, Higher Education, Adult Education
Types:
Presidential Birthday Statisticians: Math Performance Task (Grades 3-5)
In this math project your student has been commissioned to be a statistician for a very important government official. A special day is coming where our country will be honoring our past (and present) presidents.The person looking to hire them would like some interesting data, facts and findings about the president’s birthdays and their ages when they took office. They’ll be using the information you present to them in part of a special ceremony that will be televised to the country.This math pr
Subjects:
Grades:
3rd - 5th
Types:
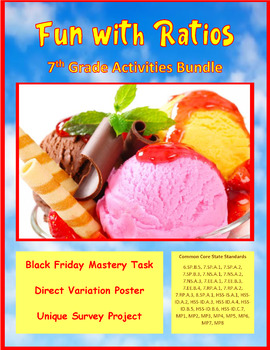
Fun with Ratios Activities Bundle - 7th Grade PBL with Math
The purpose of the Fun with Ratios Activities Bundle is to give students the opportunity to use creativity to apply ratios, proportions, and percentages in real-world settings. This bundle includes three unique tasks: Black Friday Mastery Task, Direct Variation Poster Mastery Task, and the Unique Survey Project. These activities and their accompanying materials are suited for students in grades 7 through 9. These lessons make excellent sub plans. Each project takes approximately two 60-minute bl
Subjects:
Grades:
7th - 9th
Types:
Middle School Survey Statistics Project Bundle
DescriptionA bundle of all materials needed for my Middle School Survey Project! Perfect for an end of year or statistics unit project.A fun, engaging, and active way for students to explore the foundations of statistical analysis and modeling.In this project students are tasked with creating a statistical question, surveying two relevant populations, calculating the measures of center and variability, making a dot plot, histogram, and box-and-whisker plot, and analyzing their data.Included in t
Subjects:
Grades:
6th - 9th
Project. Misleading Graphs Analysis Write Up with Rubric
Students will watch the TEDTalk How to spot a misleading graph - Lea Gaslowitz then do some research to find misleading graphs in the media!Objective. Students will research TWO misleading graphs, then create a google doc with those graphs and provide a written analysis. This is an individual assignment. Opportunity to explain...- Cherry Picking- Vertical axis manipulation- Horiztonal axis proportion- the author's motivation to graphically manipulate dataRubric is provided.
Subjects:
Grades:
8th - 12th
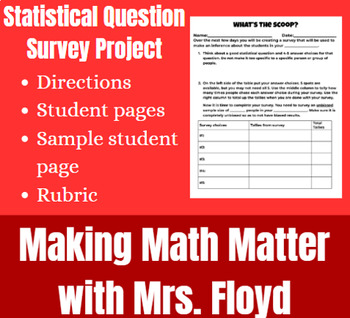
Statistical Question Survey Project
Students will be creating their own statistical questions to survey students in their grade (or school if you have a small school), the sample, and make an inference about all of the students in their grade(or school), the population. This would be great to either go along with the unit, right after, or at the end of the year for a review project. See the preview of what a project could look like for a student.Page with description, materials needed, and directionsStudent pagesSample student pag
Subjects:
Grades:
6th - 10th
Types:
Also included in: Statistics Activities Bundle
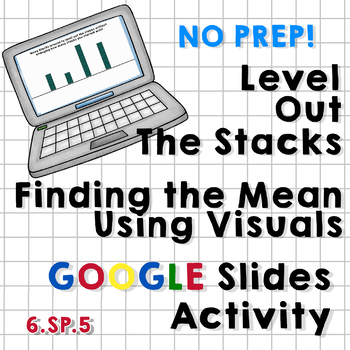
Level Out the Stacks - Finding Mean Using Visuals - Google Slides Activity
This Google Slides Activity includes 25 unique slides that help students to find the mean of a set of data using visuals first (stacks of blocks of varying heights), then eventually proving their answer by performing the actual calculations.
The slides become moderately more difficult as students progress through the activity, ending with several decimal problems where the cubes they're working with are split into fourths and the calculated mean is a decimal.
The slides are easy to duplicate
Subjects:
Grades:
5th - 7th
Types:
CCSS:
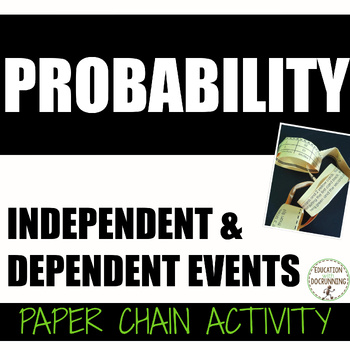
Probability Independent and Dependent Events Activity Paper Chain
Engage students at centers or in partners with this Probability Independent and Dependent Events Paper Chain Activity. Students solve probability questions involving tables, word problems, and diagrams. One link which leads to the answer on the next link. My students LOVE this activity. This resource includes:- Paper chain links with Probability problems- Answer key- Teacher's guide.A great addition to your middle school math curriculum and for differentiation.Also available in money-saving
Subjects:
Grades:
7th - 9th
Types:
CCSS:
Also included in: 7th Grade Math Activities Paper Chains Bundle
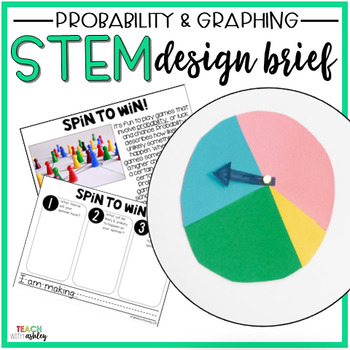
STEM Probability & Graphing: Spin It!
Looking for a creative STEM Design Brief to integrate into your probability and graphing unit? Look no further!
This STEM Probability and Graphing: Spin It! is a part of my STEM Design Brief Bundle
This product includes:
-How to Implement (2 pages)
-Background Info, Problem, Criteria, Materials, Outcome, Reflection, & Vocabulary Pages (8 pages)
-Student Planning Pages (6 pages that includes 2 different versions)
Teach With Ashley Blog
TPT Store
Instagram
Facebook
Pinterest
Subjects:
Grades:
1st - 3rd
Types:
Also included in: BUNDLE Second Grade Guided Math Probability & Graphing Unit
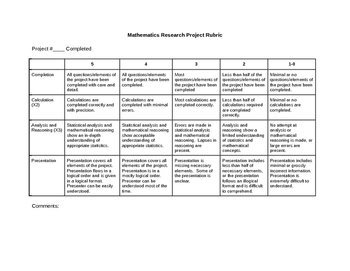
Math or Statistics Research Project Rubric
This editable rubric contains fields for project completion, calculation, analysis and reasoning, and presentation on a scale of five to one. It was originally designed for the Alberta Math 20-2 mathematics research project requirement, but is suitable for use across junior and senior high.
Subjects:
Grades:
9th - 11th

Probability for grades 6-10
This packet will guide you into putting on a school wide carnival with games of chance. I have been doing this for 15 years and it is always a success. The Rubric for the final project is included along with experiments.
Subjects:
Grades:
6th - 10th
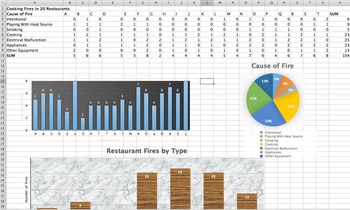
Statistics Project Unit 3 Spreadsheets Mean Median Mode Std. Deviation (2 day)
This is a 1-2 day project aimed at introducing a statistics class to Excel (or Numbers) who are familiar with Pie Charts, Bar Charts, Measures of Central Tendency, and Standard Deviation. The students will input data (included) into Excel (on fires in restaurants), form their own Bar Charts and Pie Charts, and be able to input formulas into the Excel to automatically calculate statistics. Students will be given the opportunity to explore different charts and design their charts to make them colo
Subjects:
Grades:
9th - 12th, Higher Education, Adult Education
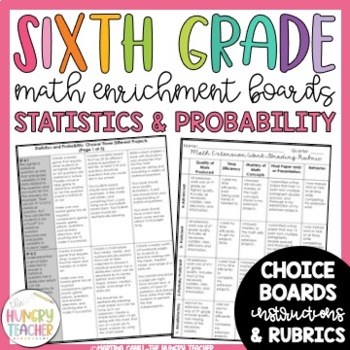
Math Enrichment Board for Statistics and Probability Sixth Grade | Choice Board
Included in this pack is the sixth grade math enrichment boards I use for my sixth grade learners who have mastered any of our statistics and probability math concepts and are now ready for a challenge. These choice boards give students choice, ownership, and a challenge through focused standard based projects. Included in this pack are the math enrichment boards I use for my sixth grade learners who have mastered Statistics and Probability concepts and are now ready for a challenge. There are t
Subjects:
Grades:
6th
Types:
Analyzing Misleading Graphs
Students are to find a graph online. They are given a url and other resources on how to find it. From there, they are to write a paragraph analyzing the validity of the graph. They are to include the title, resource, what the article is trying to convey, how it is/is not misleading, and at least two suggestions on how to make the graph more clear. Since this is a web-based assignment, it would be perfect for distance learning. Included:Student directions (in word doc so editable for your classro
Subjects:
Grades:
7th - 12th
Types:
CCSS:
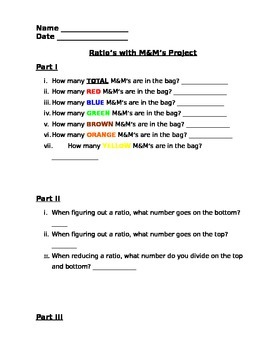
Ratios with M&M's Project
This is a quick assessment to help students figure out the ratios of M&M's in a bag. You provide the candy and I provide the worksheet. Students will be requested to open the bag, count all candies and than follow the directions marking ratios for each listed color.
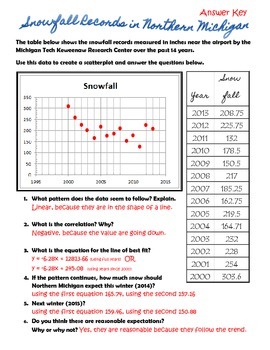
Scatter Plot Prediction Worksheet Answer Key
This is the answer key to my free download!
Subjects:
Grades:
9th - 12th
Types:
Showing 1-24 of 87 results


