159 results
Statistics laboratories for GATE
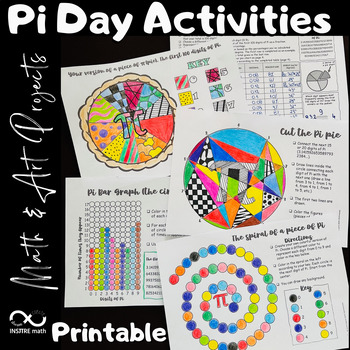
4 Pi Day Math Activities | Math & Art Projects | Coloring Circles | Pie Chart
4 Math & Art Projects to celebrate Pi Day that include circles and Pi exploration! Your students will love these Pi Day activities! Let your students express themselves using these hands-on Math & Art resources during the exploration of Pi.Content:- Your version of a piece of π (pie). The first 100 digits of Pi. Frequency Pie Chart.- Pi Bar Graph - the circular version.- The spiral of a piece of Pi.- Cut the Pi pie.This resource includes:- The editable PowerPoint™ version.- The printable
Subjects:
Grades:
4th - 8th
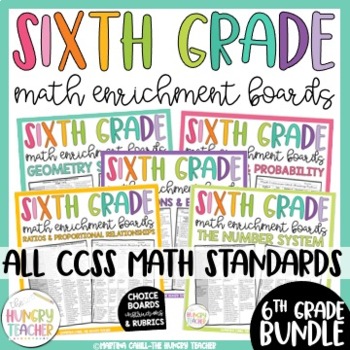
Math Enrichment Choice Board Sixth Grade for Ratios Statistics Number System
This resource includes math enrichment choice boards, rubrics, and instructions for every single 6th grade math Common Core State Standard for ratios, proportional relationships, expressions and equations, statistics and probability, geometry, and the number system. These are great for early finishers and students who need enrichment in math. Included in this pack are the math enrichment boards I use for my sixth grade learners who have mastered any of our math concepts and are now ready for a c

Football STEM Field Goal Challenge and History of Football and The Super Bowl
Super Bowl STEM Football Challenge! Looking for something to get your kids excited about learning during football season or during Super Bowl week. Engage your students with STEM Football Challenges, it also connects to Mike Lupic's book Million-Dollar Throw! STEM Football includes football terms, history of football, STEM Challenge, and a lap book that your students will love! The lap book is a great way for students to keep themselves accountable for their reading and to help them stay on
Subjects:
Grades:
3rd - 5th
Types:
NGSS:
3-5-ETS1-1
, 3-5-ETS1-2
Also included in: STEM Novel Connections and Activities

Candy Probability: Discovery of EXPERIMENTAL vs. THEORETICAL Probability
Middle Schoolers LOVE probability!
This is a GREAT lesson around Halloween when the kids are already hyped up on sugar and want to 'talk' to their classmates.
This activity allows the students to DISCOVER the differences between EXPERIMENTAL and THEORETICAL probability and connect it to everyday experiences. The probability lesson lends itself to fractions, decimals, percents, data collection, rational & irrational numbers, statistical graphs (box and whiskers, frequency tables...), measu
Subjects:
Grades:
5th - 9th
Types:
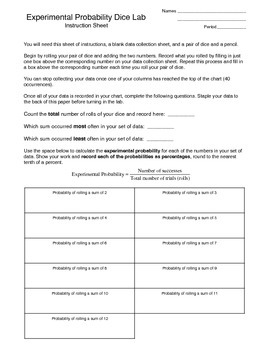
Experimental Probability Activity (dice lab)
In this activity students work with a partner to roll a pair of dice (many times) and record the sum of the dice in a data collection sheet. Once the data has been collected the students are walked through the process of calculating the experimental probability for each sum and then the theoretical probability for each sum and are asked questions about the differences they find between the values. Students also make a bar graph using the percentages for theoretical probability and can visually s
Subjects:
Grades:
7th - 11th
Types:
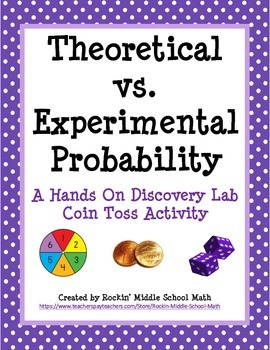
Theoretical vs Experimental Probability Lab (includes making predictions)
This is a fun, student-centered activity in which students working with a partner will conduct an experimental lab tossing 2 coins. After completing the lab, they will draw conclusions based upon the results of the activity concerning the difference between theoretical and experimental probability. Then they use experimental probability to make predictions. I have included the lab activity, a follow-up worksheet which can be used to engage student discussion after the lab, and a worksheet for
Subjects:
Grades:
6th - 9th
Types:
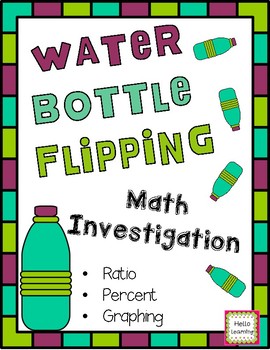
Water Bottle Flipping Investigation
Water bottle flipping- ratio, percent, measurement, data collection and graphing! The kids love bottle flipping and this product will let you bring bottle flipping into your classroom in an educational way!
Students will make predictions about the ideal water level in their water bottle that will result int he most successful flips. They will then record data about their bottle and conduct a variety of trials using different water levels to test their success with flipping their bottle at d
Subjects:
Grades:
5th - 7th
Types:
12 Days of Christmas: A Computer Spreadsheet Activity
This great holiday activity shows students how to use a computer spreadsheet to calculate the cost of their true love's gifts in today's dollars.The simple step-by-step procedure will allow both beginning and computer-savvy students to experience success as they learn how to use spreadsheet software. Students will enjoy the engaging and entertaining activity. No computer? No problem! Use the activity master so students can calculate the costs themselves.
Grades:
5th - 9th
Types:
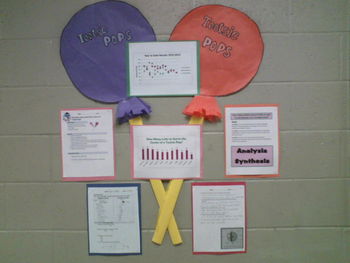
How Many Licks to the Center of a Tootsie Pop? Statistics!
Looking for novel way to get your middle school students excited about math and statistics?!
This file contains everything you need to conduct the experiment (except the Tootsie Pops!) that answers the age old question "How many licks does it take to get the center of a tootsie pop?" The lesson covers mean, median, mode, range, outliers, tables, graphs, box and whisker plots, data collection, pre and post discussion questions, experimental procedures, and student reflection. I also provided a s
Subjects:
Grades:
6th - 9th
Types:
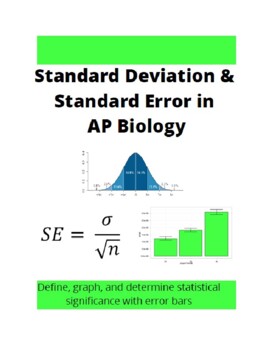
Standard Error and Standard Deviation in AP Biology
Statistics is one of those components in AP Biology that is brand new to students.Without a proper introductory lesson to standard error and standard deviation, students can struggle with this all year. Fortunately, this lesson truly walks your students through the process of defining standard deviation and error, applying the concept of error bars with statistical analysis, and graphing data with error bars to make their own statistical analysis. A PowerPoint is included as well to guide the le
Subjects:
Grades:
11th - 12th
Types:

Statistics Survey Project - Project Based Learning (PBL) with Math
Watch your students dive into the world of math as they create, execute, and analyze their own survey! Students will demonstrate mastery of data gathering, survey sampling, developing appropriate survey questions, data tables, Direct Variation, discrete graphs, dot plots, box and whisker graphs, and calculating the inter-quartile range.The Unique Survey Project is highly engaging, capitalizing on the innate curiosity of the adolescent mind. You will love the low-prep instructional guide. Your st
Subjects:
Grades:
6th - 10th
Types:
Also included in: Fun with Ratios Activities Bundle - 7th Grade PBL with Math
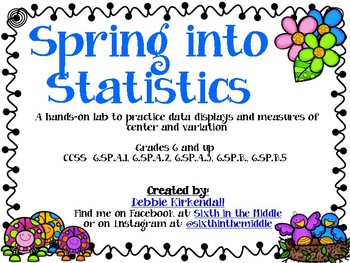
Spring into Statistics Data Displays and Measures of Center Lab
This is a hands-on lab that teaches about Statistical Questions, Data Displays (dot/line plot, histograms, box plots) and Measures of Center (mean, median, mode, and range). The lab includes notes pages, examples with answer keys, and a final project in which the student can survey classmates and create a "flower" by using their data to find mean, median, mode, range. They will also create a box plot, histogram and dot plot.
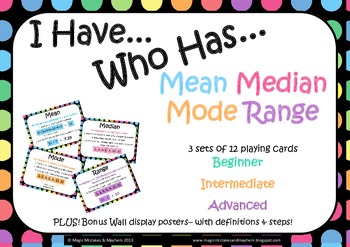
Mean, Median, Mode, Range "I Have Who Has" Game
A GREAT, FUN WAY FOR KIDS TO PRACTICE AND REINFORCE THEIR SKILLS IN THIS TRICKY TO REMEMBER AREA!3 DIFFERENT LEVELS! This pack includes 36 cards for the game "I Have Who Has" with a focus on Mean, Median, Mode and Range. The cards are split into three levels to be played in small groupsBeginner (green cards)Intermediate (orange cards)Advanced (purple cards)The aim of the game is to quickly work out the problem on your card so that when some one asks "who has...." if it is you then you can answe
Subjects:
Grades:
4th - 7th
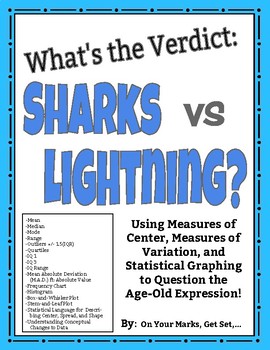
What's the Verdict: Sharks vs. Lightning? Modes of Center, Spread, and More!
Put it to the test! Use the age-old expression: "You are more likely to get struck by lightning than to be bitten by a shark!" to learn and practice Measures of Center, Measures of Spread, Measures of Shape, and Statistical Graphing including:MEANMEDIANMODERANGEOUTLIERS [Using IQR +/- 1.5(IQR)]QUARTILES [lower quartile (IQ-1) and upper quartile (IQ-3)]INTERQUARTILE RANGE (IQR)MEAN ABSOLUTE DEVIATION/ M.A.D. ft. ABSOLUTE VALUESYMMETRY/ASYMMETRY OF DISTRIBUTIONCLUSTERS AND GAPSBELL SHAPED CURVE AN
Subjects:
Grades:
5th - 12th, Higher Education, Adult Education
Types:

Sickle Cell Data Analysis: Hardy-Weinberg and Chi-Square
Want a great way to convert the "traditional" Hardy-Weinberg lab into a data problem set? Here it is! This is ideal for very small classes, where sample size could be an issue, busy classes, where you may need this for additional at-home practice, or very large classes, where the swapping of H-W cards could get too messy.Included is the full data problem set and teacher pages with the answer key.This data problem set covers:-genotypes and phenotypes-the Hardy-Weinberg equation, with application
Subjects:
Grades:
10th - 12th, Higher Education
Types:
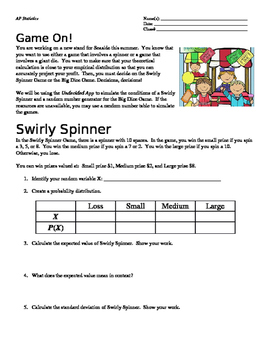
Game On! Hypothesis Testing: 1-Sample t-Test for Means Lab
This lab asks students to apply concepts of 1-sample t-test of means in a real world context. They are able to play/simulate games and determine if their theoretical calculation is accurate.
This lab integrates hypothesis testing based on two carnival games. Spiraling expected value and random variable topics from previous chapters will help themto prepare them with a "big picture" when it comes to the AP Statistics Exam.
(For the high flyers: It also asks students to develop of higher orde
Subjects:
Grades:
10th - 12th
Types:
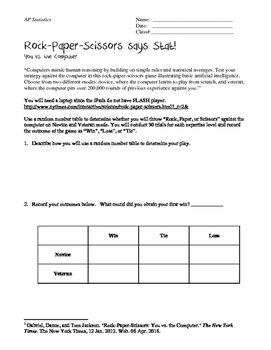
Rock, Paper, Scissors says Stat: A Chi-Square Lab
Students will utilize a Rock, Paper, Scissors website provided by the New York Times to determine whether the computer throwing Rock, Paper, Scissors is truly random. Students are asked to play the game 30 times in both modes. In addition, students are asked to call back ideas of simulation and probability to review previous learned concepts in preparation for the AP Exam to eliminate the confounding variables associated with human behavior.Please find an updated link to the simulator here: ht
Subjects:
Grades:
9th - 12th, Higher Education
Types:
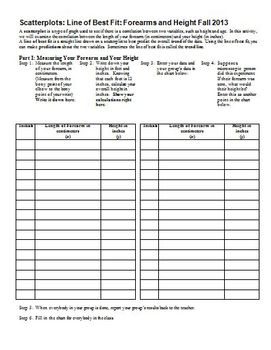
Scatterplots Linear Regression Line of Best Fit Forearms & Height (Editable)
After teaching my students about scatterplots, correlation, and the line of best fit, I take a day for them to do a hands-on lab, in which they measure their height (in inches) and their forearm length (from the tip of their elbow, to the bony point on their wrist), and we plot the class data, write the equation of the line of best fit, and then use the equation generated both forwards and backwards. They will need 45 minutes to an hour to do this in class.
I have found that if the students br
Subjects:
Grades:
7th - 12th
Types:
Presidential Birthday Statisticians: Math Performance Task (Grades 3-5)
In this math project your student has been commissioned to be a statistician for a very important government official. A special day is coming where our country will be honoring our past (and present) presidents.The person looking to hire them would like some interesting data, facts and findings about the president’s birthdays and their ages when they took office. They’ll be using the information you present to them in part of a special ceremony that will be televised to the country.This math pr
Subjects:
Grades:
3rd - 5th
Types:
Fun with Ratios Activities Bundle - 7th Grade PBL with Math
The purpose of the Fun with Ratios Activities Bundle is to give students the opportunity to use creativity to apply ratios, proportions, and percentages in real-world settings. This bundle includes three unique tasks: Black Friday Mastery Task, Direct Variation Poster Mastery Task, and the Unique Survey Project. These activities and their accompanying materials are suited for students in grades 7 through 9. These lessons make excellent sub plans. Each project takes approximately two 60-minute bl
Subjects:
Grades:
7th - 9th
Types:
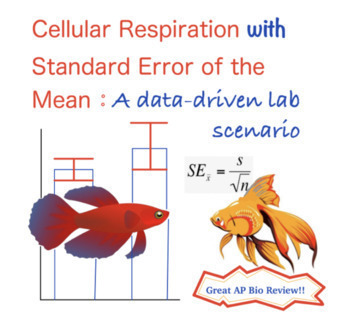
Cellular Respiration Think-it-Through Lab with Standard Error
This activity allows students to review basic concepts of cellular respiration in the context of a lab scenario. Students will work with data and complete calculations including percent change, mean, standard deviation, and standard error. In addition, students will see how error bars are drawn and learn how to interpret them on a graph. Activity A: Introduction (background, lab design, etc)Activity B: Working with data (percent change and mean calculations)Activity C: Calculating standard e
Subjects:
Grades:
9th - 12th, Higher Education, Adult Education
Types:
Also included in: Cell Resp Think-It-Through Lab with Standard Error and Answer Key
Cell Resp Think-It-Through Lab with Standard Error and Answer Key
This activity allows students to review basic concepts of cellular respiration in the context of a lab scenario. Students will work with data and complete calculations including percent change, mean, standard deviation, and standard error. In addition, students will see how error bars are drawn and learn how to interpret them on a graph.Activity A: Introduction (background, lab design, etc)Activity B: Working with data (percent change and mean calculations)Activity C: Calculating standard error
Subjects:
Grades:
11th - 12th
Types:
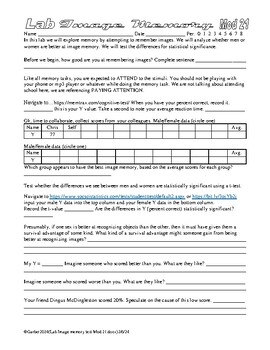
Psychology Lab Image Memory and Sex Differences AP Psychology Statistics
In this set of 13 labs the students do a variety of image memory tasks. They then collaborate and share data, then perform a T test on the data to find out if the differences between the scores of men and women are statistically significant. The students also test for correlations between a variety of scores. I suppose it is a sort of an expansion on my face memory lab. Links sometimes die, so try before you buy… https://www.psychologytoday.com/us/tests/iq/memory-test https://memtrax.com/cogniti
Subjects:
Grades:
9th - 12th, Higher Education, Adult Education
Types:
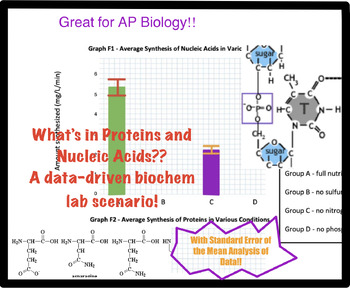
Proteins & Nucleic Acids - What's in Them? Biochem analysis w/ Standard Error
This activity allows students to review basic information related to the 4 classes of biological macromolecules and carbon before exploring the chemical composition of proteins and nucleic acids in this "minds-on" data-driven activity. Students will work with data and complete calculations including percent change, mean, standard deviation, and standard error. In addition, students will see how error bars are drawn and learn how to interpret them on a graph, ultimately reaching conclusions abou
Subjects:
Grades:
9th - 12th
Types:
Showing 1-24 of 159 results


