58 results
Free 7th grade statistics resources for Microsoft PowerPoint

Celebrity Birthday Fun Probability Activity for Pre-Algebra and Algebra classes
This 12 minute narrated, animated PowerPoint presentation makes learning the difference between theoretical probability and experimental or empirical probability fun for students. It is intended for 7th, 8th, or 9th grade Algebra classes. It reviews a few Key terms such as probability, event, sample space, etc. and then concentrates on the famous probability birthday problem or paradox in which given a group of 50 people, 97% will share the same birthday.
Three student handouts are included
Subjects:
Grades:
7th - 10th
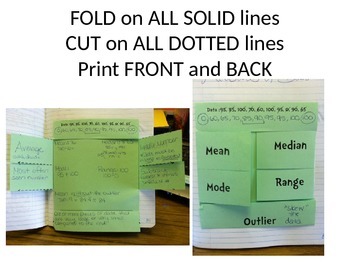
Mean, Median, Mode, Range, Outlier FOLDABLE
This is a download for a one page cut only foldable. Directions are simple, CUT on all dotted lines, FOLD on all solid lines. Gives you 6 flaps to write under with vocabulary on top.
Also includes one set of data to find the mean, median, mode and range (answers included).
This is downloaded in powerpoint, so it can be changed if you do not need the "oulier" topic.
Also, this is an EVEN number of data, so the median will have to be found between 2 numbers: 85 and 90.
This involves deci
Subjects:
Grades:
6th - 8th
Types:
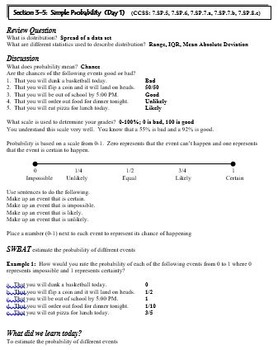
Statistics and Probability: Simple, Theoretical, Experimental, Probability
This is a 7 day lesson plan (powerpoint and hard copy) covering the topics of simple, theoretical, and experimental probability. Each lesson includes a review question, discussion, problems for teacher to model, and problems for the students to try. The lesson plan includes days of instruction, days of practice, assignments, and activities.
Subjects:
Grades:
7th - 9th
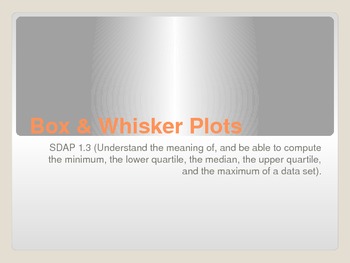
Box and Whisker Plot PowerPoint
This is a PowerPoint presentation on how to use data to make a box-and-whisker plot. It contains step-by-step instructions, tips to reduce common errors, independent and group practice slides, and a partnered kinesthetic activity. Enjoy!
Subjects:
Grades:
5th - 8th
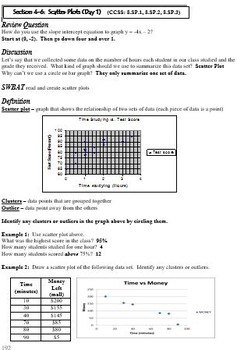
Statistics and Probability: Scatter Plots and Best Fit Lines
This is a 9 day lesson plan (powerpoint and hard copy) covering the topics of scatter plots and best fit lines. Each lesson includes a review question, discussion, problems for teacher to model, and problems for the students to try. The lesson plan includes days of instruction, days of practice, assignments, activities, and a project.
Subjects:
Grades:
7th - 9th

2 Dice Probability Bingo Game
Simple Bingo game where students can use a bingo game as an experiment to discover which values are the highest probability in either the sum of 2 dice or the difference of 2 dice.
Students fill in the sheets with values they think will come up. They get to fill in one square per round if the have a value that matches the sum/difference of the dice. After the first game is played, it should be played again to allow students to use their understanding to improve their chances. Eg. using more
Subjects:
Grades:
5th - 8th
Types:
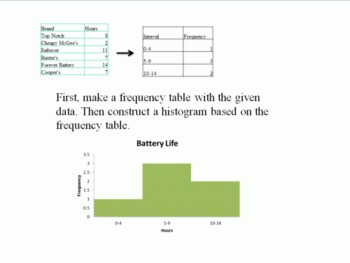
Graphs and Statistics
These five lessons cover the basics about describing sets of data. Topics covered are mean, median, mode and range. There is also information about bar graphs, histograms, line graphs, and circle graphs, as well as line plots and frequency tables. There is also a lesson about misleading graphs and statistics, providing a great opportunity to teach CCSS.Math.Practice.MP3 (Construct viable arguments and critique the reasoning of others.)
This work is licensed under a Creative Commons Attribution-
Subjects:
Grades:
5th - 7th

Celebrity Age Scatter Plot Activity
A fun way to gather data for a scatter plot. Students guess celebrity ages and compare to the real age. Plot data on a scatter plot and analyze the correlation. I have my students do this on large sheets of paper in groups with color-coded stickers at the end of 8th grade. This is updated as of May 2018. Ages (and pics) will need to be updated each year. You will probably want to choose a few different celebrities as mine are specific to people students in a Catholic school in Kansas City would
Subjects:
Grades:
6th - 11th
CCSS:
Determining a random sample
This activity, as part of 7.SP.1, provides two levels of difficulty. The lower level cards provide students with a scenario and students must decide if this is an example of a random sample or not. The higher level cards are multiple choice. Students are provided with a scenario and students must select the best response.
Subjects:
Grades:
6th - 8th
Types:
CCSS:

Measures of Central Tendency PowerPoint
Here lies a PowerPoint for a quick review of how to choose the most beneficial measure of central tendency and how to calculate a "wanted" or "missing" piece of data when using mean. This makes a good math center, bellwork, or whole class discussion. Sometimes I use it to pre-test; sometimes for a post-test. ENJOY!
Subjects:
Grades:
7th - 9th

Samples and Populations
This lesson will allow students to understand the concept of Samples and Populations. It has the content and videos which will provide students an engaging lesson. It also has links to an online survey that you as the teacher can conduct and control (This will need to be adapted to suit your specific class). Also included is question examples and activities for the students to engage with. The lesson goes through the following topics: samples, populations, surveys, census questionnaires and coll
Subjects:
Grades:
7th - 9th
CCSS:
Probability and Tree Diagrams
This PowerPoint can be used as a resource on how to draw Tree Diagrams. It goes through drawing out Tree Diagrams step by step and has many questions that can be used to solve as a class
Subjects:
Grades:
7th
Types:
Misleading data displays
This PPT is suitable for Data Representation and Interpretation -Interpret secondary data presented in digital media and elsewhere (ACMSP148) Identify potentially misleading data representations in the media, such as graphs with broken axes or non-linear scales, graphics not drawn to scale, data not related to the population about which the claims are made, and pie charts in which the whole pie does not represent the entire population about which the claims are made investigating data represent
Subjects:
Grades:
6th - 8th
Types:
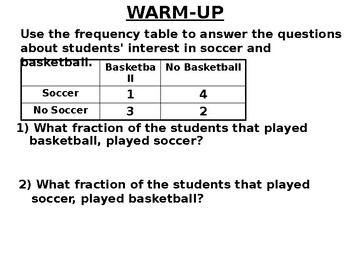
Math 8 19.6 Find the Relative Frequencies of the Data
This editable lesson was written by Alex Benn using the concepts described in his book Tenacious-Teaching: Uniting Our Superpowers to Save Our Classrooms and his website: Tenacious-Teaching.com. It includes an introductory warm-up designed to remediate the required prerequisite knowledge; concise notes; tasks that require escalating effort; numerous examples to prevent misconceptions; and in-class practice problems to promote mastery. It does not include answers to the tasks provided. Those are
Subjects:
Grades:
7th - 9th
Types:
Also included in: Math 8 Unit 19 Fractions, Percents, and Statistics
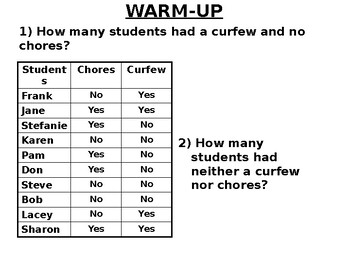
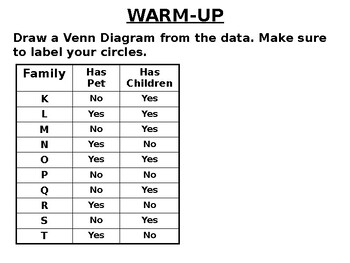
Math 8 19.1 Put Data into Venn Diagrams and Frequency Tables
This editable lesson was written by Alex Benn using the concepts described in his book Tenacious-Teaching: Uniting Our Superpowers to Save Our Classrooms and his website: Tenacious-Teaching.com. It includes an introductory warm-up designed to remediate the required prerequisite knowledge; concise notes; tasks that require escalating effort; numerous examples to prevent misconceptions; and in-class practice problems to promote mastery. It does not include answers to the tasks provided. Those are
Subjects:
Grades:
7th - 9th
Types:
Also included in: Math 8 Unit 19 Fractions, Percents, and Statistics
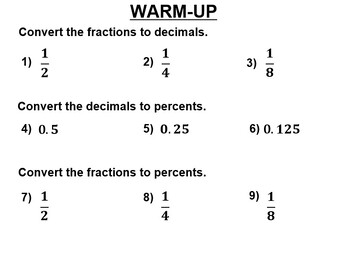
Math 8 19.3 Fractions to Decimals to Percents
This editable lesson was written by Alex Benn using the concepts described in his book Tenacious-Teaching: Uniting Our Superpowers to Save Our Classrooms and his website: Tenacious-Teaching.com. It includes an introductory warm-up designed to remediate the required prerequisite knowledge; concise notes; tasks that require escalating effort; numerous examples to prevent misconceptions; and in-class practice problems to promote mastery. It does not include answers to the tasks provided. Those are
Subjects:
Grades:
7th - 9th
Types:
Also included in: Math 8 Unit 19 Fractions, Percents, and Statistics
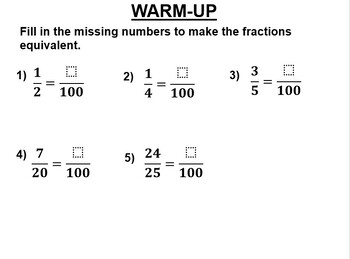
Math 8 19.2 Convert Fractions to Percents
This editable lesson was written by Alex Benn using the concepts described in his book Tenacious-Teaching: Uniting Our Superpowers to Save Our Classrooms and his website: Tenacious-Teaching.com. It includes an introductory warm-up designed to remediate the required prerequisite knowledge; concise notes; tasks that require escalating effort; numerous examples to prevent misconceptions; and in-class practice problems to promote mastery. It does not include answers to the tasks provided. Those are
Subjects:
Grades:
7th - 9th
Types:
Also included in: Math 8 Unit 19 Fractions, Percents, and Statistics
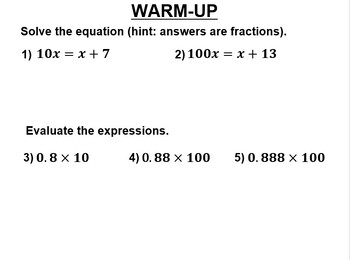
Math 8 19.5 More Repeating Decimals to Fractions
This editable lesson was written by Alex Benn using the concepts described in his book Tenacious-Teaching: Uniting Our Superpowers to Save Our Classrooms and his website: Tenacious-Teaching.com. It includes an introductory warm-up designed to remediate the required prerequisite knowledge; concise notes; tasks that require escalating effort; numerous examples to prevent misconceptions; and in-class practice problems to promote mastery. It does not include answers to the tasks provided. Those are
Subjects:
Grades:
7th - 9th
Types:
Also included in: Math 8 Unit 19 Fractions, Percents, and Statistics
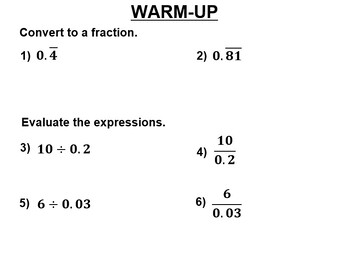
Math 8 19.4 Repeating Decimals to Fractions
This editable lesson was written by Alex Benn using the concepts described in his book Tenacious-Teaching: Uniting Our Superpowers to Save Our Classrooms and his website: Tenacious-Teaching.com. It includes an introductory warm-up designed to remediate the required prerequisite knowledge; concise notes; tasks that require escalating effort; numerous examples to prevent misconceptions; and in-class practice problems to promote mastery. It does not include answers to the tasks provided. Those are
Subjects:
Grades:
7th - 9th
Types:
Also included in: Math 8 Unit 19 Fractions, Percents, and Statistics
Math 8 Review Unit 19 Fractions Percents Statistics
This editable lesson was written by Alex Benn using the concepts described in his book Tenacious-Teaching: Uniting Our Superpowers to Save Our Classrooms and his website: Tenacious-Teaching.com. It includes an introductory warm-up designed to remediate the required prerequisite knowledge; concise notes; tasks that require escalating effort; numerous examples to prevent misconceptions; and in-class practice problems to promote mastery. It does not include answers to the tasks provided. Those are
Subjects:
Grades:
7th - 9th
Types:
Also included in: Math 8 Unit 19 Fractions, Percents, and Statistics

Real Numbers
Much of this material should be familiar to you, but some of it may be new. Although it is only a language or set of rules to help you deal with statistics, without it you will not be able to make sense of the following chapters. Before you continue, make sure you have completed all the learning activities and understood what you have done.
Subjects:
Grades:
7th - 9th

Mean, Median, Mode, and Range Lesson
This is a PowerPoint that explains how to find the mean, median, mode, and range. In this lesson, there is a choice board that contains activities for different learning styles based on Howard Gardner's Multiple Intelligence.
Subjects:
Grades:
4th - 8th
Types:

Intro to Mean Absolute Deviation
This PowerPoint explains what mean absolute deviation is and how to find it. Gives some easy practice sets for students. I created this while teaching 6th grade mathematics to help my students understand the concept. My district required me to introduce the topic, and wanted students to have a general understanding of how to find the mean absolute deviation, so the PowerPoint does not go too deep.
Subjects:
Grades:
6th - 9th
Showing 1-24 of 58 results


