263 results
7th grade Martin Luther King Day statistics resources for Easel Activities
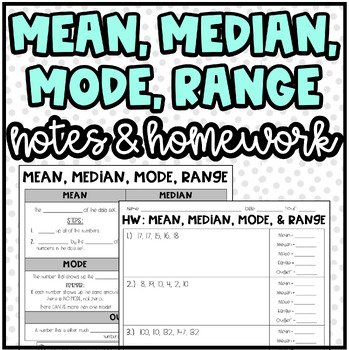
Mean, Median, Mode, Range, and Outlier | Notes and Homework or Practice
Notes & Homework: Mean, Median, Mode, Range, and Outlier:I used these notes, practice, and homework with my students. I used this lesson to serve as a "quick lesson" for the students. It covers how to find the mean, median, mode, range, and outlier.Product Includes:Notes Page with 2 examplesNotes Page Answer KeyHomework (10 organized problems with workspace provided)Homework Answer KeyThank You! ❤️I really appreciate your interest in my product! I love to create new things for my students! A
Subjects:
Grades:
5th - 8th
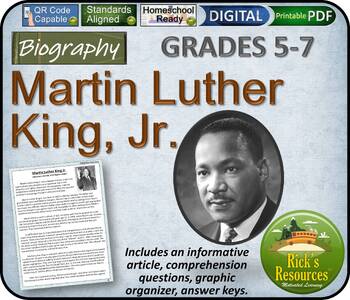
Martin Luther King Jr. Biography Reading Comprehension - Print and Digital
Learn about the inspiring life of Martin Luther King Jr. with this reading comprehension resource, designed for 5th to 7th graders. This unit offers a detailed exploration of one of history’s most influential figures and includes activities and questions to enhance students' understanding and reading skills. Includes printable PDF and interactive digital formats (Google Slides™ and Easel). It's perfect for classroom, homeschool, and distance learning settings.KEY FEATURESEngaging Biography: Lear
Grades:
5th - 7th
Types:
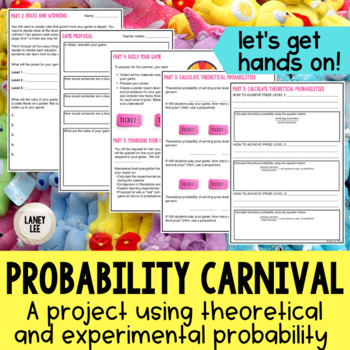
Probability Carnival Game Project - PDF & Digital
Looking for a fun, hands on way to bring probability to life? Are you ready to move past the "sit and get" style of whole group instruction? If you answered yes to either of those questions, then this resource is for you!Keep your students engaged and accountable with the interactive, versatile Probability Carnival! The steps of this project are designed to be rigorous and require students to predict, reflect, connect, and think critically about the situations being investigated.Using this proje
Subjects:
Grades:
6th - 8th
Types:
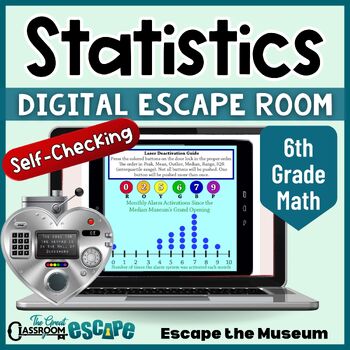
6th Grade Math Data Analysis & Statistics Activity Digital Escape Room Game
Find the median, read the box plot, interpret the frequency table, and unlock the door! This 6th grade math activity based on statistics and probability standards will put your students statistical skills to the test. Your students are volunteer docents at the Median Museum. After the security system locks everyone in, they will need to use their knowledge of statistics to escape the museum. This engaging digital escape room is easy for teachers to implement. The breakout process is fully autom
Subjects:
Grades:
6th - 7th
Types:
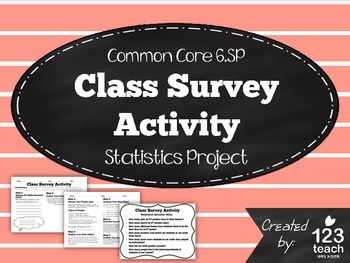
Class Survey Activity - Common Core 6th Grade Statistics Project
This "Class Survey Activity" includes a two page activity aligned to common core standards for statistics and probability (6.SP).
Students will have to come up with a statistical question to survey their classmates. Then, the students will record their results, create a graph, and analyze their data. Lastly, the students will present their results with the class. With my class, I give the students at least a full class period to complete the activity, and then it takes another class perio
Subjects:
Grades:
5th - 7th
Types:
Also included in: Math Assessments and Review Activities BUNDLE for 6th Grade Common Core
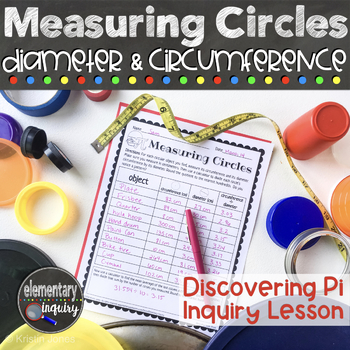
Measuring Circle Circumference & Diameter to Discover Pi - Pi Day Inquiry Lesson
Have fun finding Pi by measuring the circumference and diameter of circles of all sizes! Students will calculate the ratio of the length of a circle’s diameter to its circumference. They’ll discover that the circumference is always a little more than three times as long as the diameter. This full lesson plan and teacher script will help you lead an inquiry based investigation and class discussion. It’s perfect for an introduction to these geometry concepts, or for a fun Pi Day activity.A full, f
Subjects:
Grades:
5th - 7th
Types:
CCSS:
Also included in: Pi Day Activities - Measuring Circles Diameter, Circumference, and Area
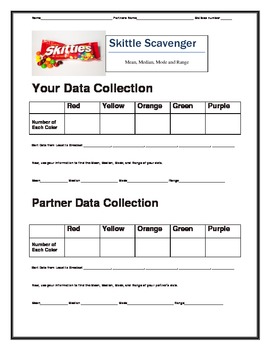
Skittles Candy with Mean, Median, Mode, Range, and Box and Whiskers Plot
This is a quick, fun activity to use with statistics. I have the kids bring in a pack of skittles and sort by color. Then all of the kids will find the Mean, Median, Mode, Range, and Box and Whiskers.
Subjects:
Grades:
4th - 8th
Types:
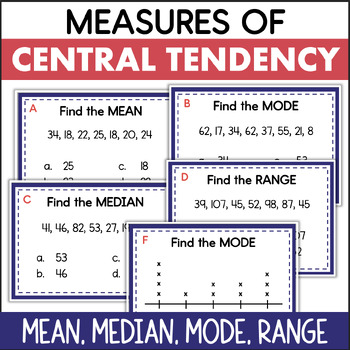
Mean Median Mode Range Measures of Central Tendency Data Task Cards
These data task cards are a great way for students to practice analyzing data to find the mean, median, mode, and range!There are several types of questions, all addressing measures of central tendency. Some require students to interpret a data set of whole numbers. Others involve data presented in a line plot. The last type of question requires the student to choose the correct method for finding the mean, median, mode, or range.This math resource includes:16 task cardsrecording sheetanswer key
Subjects:
Grades:
5th - 7th
Types:
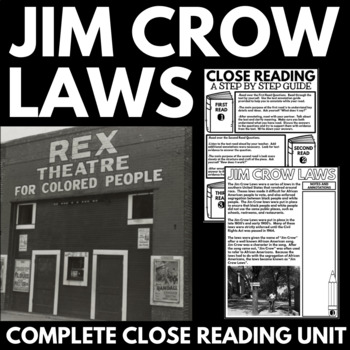
Jim Crow Laws - Racial Segregation - Black History Close Reading Passages
Looking for resources about racial segregation and the Jim Crow Laws to engage student during Black History Month? These civil rights movement activities contain close reading activities, a reading passage, questions, and graphic organizers.✅Be sure to check out the thumbnails and preview for images and information about some of the great resources included in this product.****************************************This engaging resource contains the following:⭐Jim Crow Laws Reading Passage: A two
Grades:
4th - 7th
Also included in: Black History Close Reading Passages - Civil Rights Movement Projects
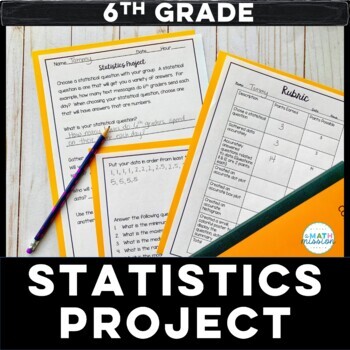
Math Statistics Project Based Learning Dot Plot Box Plot Histogram
Set your students loose to practice their statistics skills! This project is great for a culminating assessment. This project is centered around students coming up with a statistical question, and gathering data on that question. Students answer statistical questions, and create a dot plot, box and whisker plot and histogram based on the data collected. A summary of their findings is then created to display for others to see. A rubric is included for grading purposes. This project actively
Subjects:
Grades:
5th - 7th
Types:
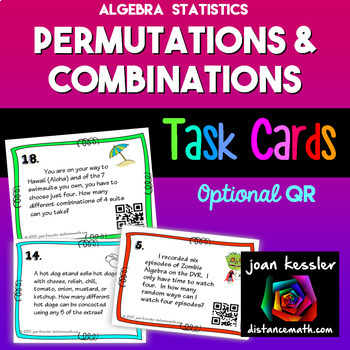
Permutations and Combinations Task Cards plus QR
This set of Combinations, Permutations, and Counting Task Cards with applications will really have your students thinking.This activity reinforces the concepts of permutations, combinations, and counting principles. The concepts are not separated on the cards, nor coded, so students must first decide what type of question it is before solving. The cards can also be used for a sorting activity. The difficulty levels are mixed on the cards. Included: Two sets of 24 cards, one with QR codes and
Subjects:
Grades:
7th - 10th
Types:
CCSS:
Also included in: Algebra 1 Activity Bundle
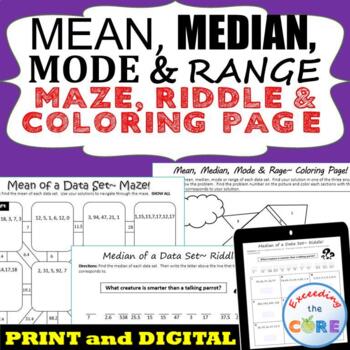
MEAN, MEDIAN, MODE, & RANGE Mazes, Riddles & Coloring Page | Print and Digital
Have your students apply their understanding of finding the MEAN, MEDIAN, MODE, & RANGE of data sets with these fun activities including a maze, riddle and coloring activity. What is Included:1. Finding the Mean MAZEThis is a self-checking worksheet that allows students to strengthen their understanding of finding the mean of positive whole numbers. Students use their answers to navigate through the puzzle.2. Finding the Median RIDDLEStudents find the median of positive whole numbers and use
Subjects:
Grades:
5th - 7th
Types:
Also included in: 6th Grade Math Assessments, Notes, Task Cards, Worksheets BUNDLE
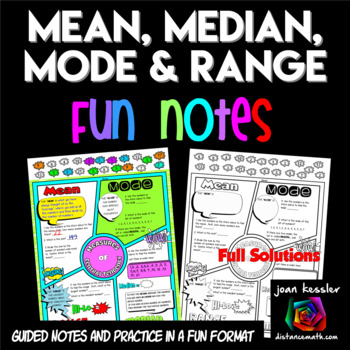
Measures of Central Tendency FUN Notes Doodle Pages
Your students will love learning the Measures of Central Tendency with these Fun Notes done in a comic book theme. Topics include Mean, Median, Mode, and Range. Students complete 6 problems plus definitions. There are two versions of the notes so you can differentiate. The PDF also includes 2 sizes, one standard 81/2 x 11" and the other in half size for INB's. Students love to doodle while learning and it has been shown that doodling and working with fun themed activities help students engage
Subjects:
Grades:
6th - 9th
Also included in: Algebra 1 FUN Notes Doodle Page Bundle
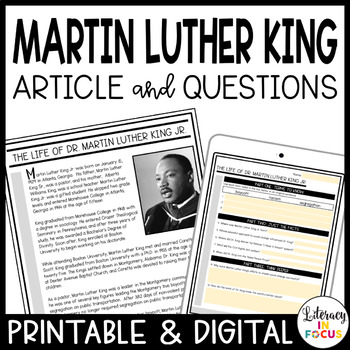
Martin Luther King Jr Passage and Questions | Print & Digital | MLK Day
Focus on the life of Martin Luther King Jr. and support reading comprehension skills! This activity includes a nonfiction article and text-based questions, perfect for studying the life and legacy of Martin Luther King Jr. This resource can be completed on paper or online with laptops, Chromebooks, tablets, or any device that supports Google Drive. The included Teacher's Guide includes access to the link that will allow you to make your own copy of the resource for use in Google Classroom/Googl
Grades:
5th - 8th
Types:
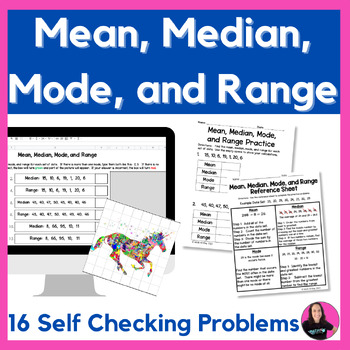
Measures of Central Tendency - Mean, Median, Mode, and Range Activity
In this 6th grade math resource, students will practice finding the mean, median, mode, and range. They will calculate the measures of central tendency with 16 problems, using four different sets of data. This activity is digital and printable. One of the printable pages is a reference sheet, which gives an example set of data and how to find the mean, median, mode, and range.For the digital activity, students will love watching the mystery picture reveal itself as more and more questions ar
Subjects:
Grades:
5th - 7th
Types:
CCSS:
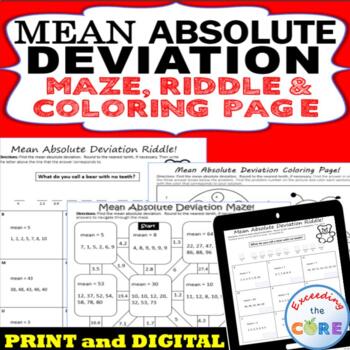
MEAN ABSOLUTE DEVIATION Mazes, Riddles & Coloring Page | Print and Digital
Have your students apply their understanding MEAN ABSOLUTE DEVIATION with these fun activities including a maze, riddle and coloring activity.What's Included:1. Mean Absolute Deviation MAZEThis is a self-checking worksheet that allows students to strengthen their understanding of finding the mean absolute deviation. Students use their answers to navigate through the puzzle.2. Mean Absolute Deviation RIDDLEStudents find the mean absolute deviation of various data sets. Students use their answer
Subjects:
Grades:
5th - 7th
Types:
Also included in: 6th Grade Math Assessments, Notes, Task Cards, Worksheets BUNDLE
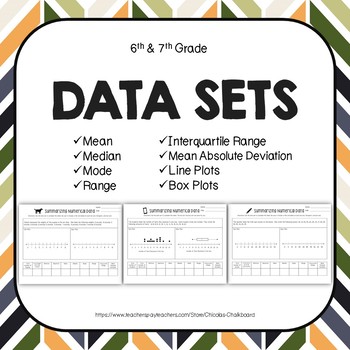
Data Sets: Mean, Median, Mode, Range, Interquartile Range, Box Plots, Dot Plots
Using this activity, students will be able to analyze data sets using box plots and dot plots. They will find the following: minimum, maximum, mean, median, mode, range, interquartile range, and mean absolute deviation. They will also create the box plots and dot plots using the data provided. This set includes: -Common Core State Standards-Two Reference Sheets (Key Data Set Terms and How to Create a Box Plot)-Four Different Data Worksheets 1. One data sheet that includes a completed dot p
Subjects:
Grades:
5th - 7th
Types:
Sweets Probability Activities (chocolate, candy, M&Ms, Skittles, Kisses)
Uses chocolates or candy (M&Ms, Skittles, Kisses) to practice probability!
What's included-
*Colored candy probability activity: have students randomly pick colored candy and tally what's picked to experiment probability
*Colored candy probability activity reflection page- have students reflect on the experiment and explain their thinking
*M&M's probability activity: have students figure out how many M&M's are in a bag and what color of each by using probability
*M&M's probabil
Subjects:
Grades:
2nd - 8th
Types:
Also included in: Probability Activity BUNDLE
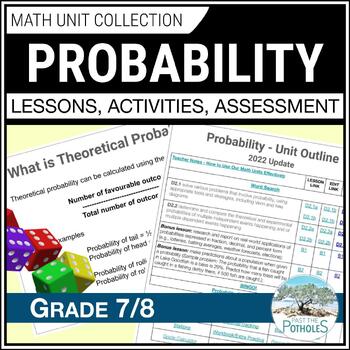
Theoretical and Experimental Probability Activities Grade 7/8 Ontario Math Unit
SAVE YOUR VALUABLE TIME! Ontario math teachers love our UPDATED Probability units! Lesson plans, centres, activities, worksheets, and assessments cover theoretical probability, experimental probability, tree diagrams and more.Our units encourage students to use and develop their Knowledge, Application, Thinking, and Communication skills in a way that will prepare them for success in the future."I have used many of the Ontario Math resources created by Past The Potholes and love them all. The Go
Subjects:
Grades:
7th - 8th
Types:
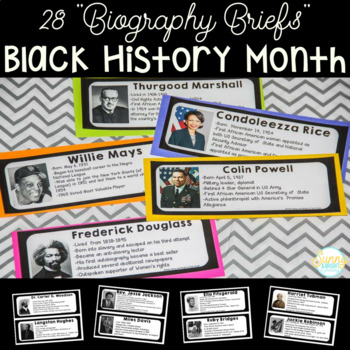
Black History Month
This Black History Month unit introduces your students to the accomplishments of 28 different African Americans through "biography briefs". They make a fabulous Black History Month bulletin board display and are the perfect place to begin class discussions and/or student research. There are 28 cards included- one for each day in February!
This packet is designed to give your students an overview of the impact that African Americans have made in the areas of politics, civil rights, music, spor
Grades:
K - 10th
Also included in: Black History Month Biography BUNDLE
Mean Dice Math: mean, median, mode, and range
"Mean Dice" uses dice to practice calculating mean, median, mode, and range. Comes with two versions, each with a whole group introductory activity, an independent practice worksheet, and instructions for both levels of the "Mean Dice" game. Note: versions of this activity appear in EZSubPlans 4.1 and 6.1.
Subjects:
Grades:
4th - 7th
Types:
Histograms Interpreting and Creating Worksheet
Hey Math Teachers! This Histograms Worksheet is the perfect resource to help your students master constructing and interpreting histograms. This two-sided Math worksheet includes progressively challenging problems on displaying numerical data using histograms and questions on interpreting histograms. We provide scaffolding to help your students identify the components of a set of data, assess the skew of data, and report the number of observations.This worksheet is suitable for Middle School Mat
Subjects:
Grades:
6th - 9th
Types:
CCSS:
Also included in: Data and Statistics Worksheets Bundle
Independent & Dependent Probability Color by Number (Distance Learning)
Students of all ages love to color! Make practicing more fun with this color by number activity.Note: Using a digital color by number activity works best with iPads where coloring can be done using an app such as Notability.Students will calculate the probability of independent and dependent events. Twelve word problems are included. The focus is on learning about compound events. Specifically, students will examine the difference between independent events (with replacement) and dependent e
Subjects:
Grades:
6th - 9th
Types:
Also included in: Color by Number Bundle
Box and Whisker Plots Worksheet
Hello Math Teachers! Are you looking for a fun and engaging way to teach your students about Box and Whisker Plots? Our baseball-themed worksheet is perfect for middle school and algebra classes, as well as any statistics unit.This comprehensive worksheet includes both single and double box plots, and is designed to help students progress from interpreting box plots with quartiles, interquartile range, range, and median to constructing their own box plots. The two-sided worksheet comes with an e
Subjects:
Grades:
7th - 8th
Types:
CCSS:
Also included in: Data and Statistics Worksheets Bundle
Showing 1-24 of 263 results


