TPT
Total:
$0.00

Data Sets: Mean, Median, Mode, Range, Interquartile Range, Box Plots, Dot Plots

Rated 4.85 out of 5, based on 26 reviews
4.9 (26 ratings)
;
Chicola's Chalkboard
120 Followers
Grade Levels
5th - 7th
Resource Type
Standards
Formats Included
  • PDF
Pages
13 pages
$3.00
$3.00
Share this resource
Report this resource to TPT
Chicola's Chalkboard
120 Followers
Easel Activity Included
This resource includes a ready-to-use interactive activity students can complete on any device.  Easel by TPT is free to use! Learn more.

What educators are saying

This was a great practice activity for students to practice making box plots with varying difficulty in each data set.
This was a great source for practice in our stations. We also used this as an end of the year review. My students enjoyed it very much. We used it during our station rotations through the whole 6th grade.

Description

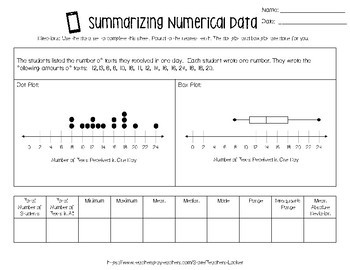
Using this activity, students will be able to analyze data sets using box plots and dot plots. They will find the following: minimum, maximum, mean, median, mode, range, interquartile range, and mean absolute deviation. They will also create the box plots and dot plots using the data provided.

This set includes:

-Common Core State Standards

-Two Reference Sheets (Key Data Set Terms and How to Create a Box Plot)

-Four Different Data Worksheets

1. One data sheet that includes a completed dot plot and box plot

2. One data sheet that includes a completed dot plot and box plot with a blank

data set for students to fill in

3-4.Two data sheets that include blank number lines for students to create dot

plots and box plots using a data set

-Answer Keys for Each Worksheet

This set meets CCSS for 6th grade students, and it could be used at many levels to review. It could also be used as enrichment for 5th Grade.

*** This product is now available with a word wall! The word wall includes a visual representation for each term.

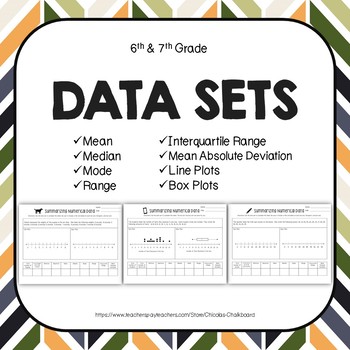
Data Sets and Word Wall

Total Pages
13 pages
Answer Key
N/A
Teaching Duration
N/A
Last updated Feb 15th, 2022
Report this resource to TPT
Reported resources will be reviewed by our team. Report this resource to let us know if this resource violates TPT’s content guidelines.

Standards

to see state-specific standards (only available in the US).
Display numerical data in plots on a number line, including dot plots, histograms, and box plots.
Summarize numerical data sets in relation to their context, such as by:
Reporting the number of observations.
Giving quantitative measures of center (median and/or mean) and variability (interquartile range and/or mean absolute deviation), as well as describing any overall pattern and any striking deviations from the overall pattern with reference to the context in which the data were gathered.

Reviews

Questions & Answers

120 Followers