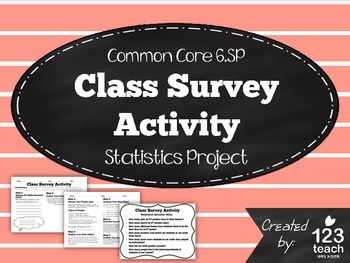
Class Survey Activity - Common Core 6th Grade Statistics Project
Brittany Kiser
3.2k Followers
Grade Levels
5th - 7th
Subjects
Resource Type
Standards
CCSS6.SP.A.1
CCSS6.SP.A.2
CCSS6.SP.A.3
CCSS6.SP.B.4
CCSS6.SP.B.5
Formats Included
- PDF
- Easel Activity
Pages
4 pages
Brittany Kiser
3.2k Followers
Easel Activity Included
This resource includes a ready-to-use interactive activity students can complete on any device. Easel by TPT is free to use! Learn more.
What educators are saying
This was the perfect last month of school activity to take up a few days, let the students be creative, and practice those statistics skills.
I used the activity in my classroom as a review before a quiz. The students were engaged to complete the assignment. I will use it with my classroom students this year.
Also included in
- This bundle includes assessments and review activities for the entire year! You can follow this link to see all of my 6th grade common core resources:6th Grade Common Core ResourcesAs new 6th grade products are added to my store, the products will also be added to this bundle. Check out the previePrice $127.92Original Price $182.75Save $54.83
Description
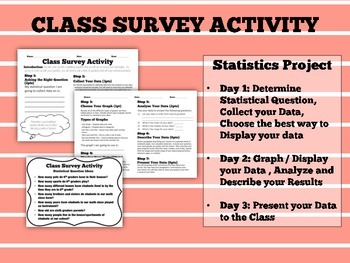
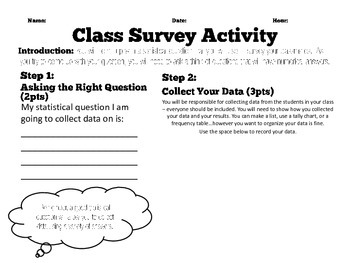
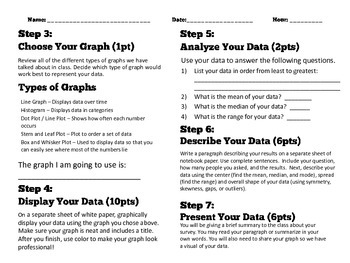
This "Class Survey Activity" includes a two page activity aligned to common core standards for statistics and probability (6.SP).
Students will have to come up with a statistical question to survey their classmates. Then, the students will record their results, create a graph, and analyze their data. Lastly, the students will present their results with the class. With my class, I give the students at least a full class period to complete the activity, and then it takes another class period to allow the students to present their results. My students love this activity and I know your students will too!
Notes: Students will need to come up with statistical questions that have numerical answers to best complete this activity. For example, "How many pets do you have?", "How many people are in your family?", etc.
You can purchase ALL of my 6th grade Common Core Resources HERE:Common Core Assessments and Activities BUNDLE for 6th Grade Math!
Check out my other Statistics and Probability Products here:
Zonk! 6th Grade Review Game - Statistics and Probability
This purchase is for personal use only.
© Brittany Kiser. Please note - this resource is for use by one teacher only. If other teachers at your school would like to use the materials, please purchase additional licenses. Thank you!
Total Pages
4 pages
Answer Key
N/A
Teaching Duration
2 days
Report this resource to TPT
Reported resources will be reviewed by our team. Report this resource to let us know if this resource violates TPT’s content guidelines.
Standards
to see state-specific standards (only available in the US).
CCSS6.SP.A.1
Recognize a statistical question as one that anticipates variability in the data related to the question and accounts for it in the answers. For example, “How old am I?” is not a statistical question, but “How old are the students in my school?” is a statistical question because one anticipates variability in students’ ages.
CCSS6.SP.A.2
Understand that a set of data collected to answer a statistical question has a distribution which can be described by its center, spread, and overall shape.
CCSS6.SP.A.3
Recognize that a measure of center for a numerical data set summarizes all of its values with a single number, while a measure of variation describes how its values vary with a single number.
CCSS6.SP.B.4
Display numerical data in plots on a number line, including dot plots, histograms, and box plots.
CCSS6.SP.B.5
Summarize numerical data sets in relation to their context, such as by:

