Excel Graphing Easter Fruit Snacks with Digital Student Directions
- PDF
- Google Apps™
- Excel Spreadsheets

Description
How About a Little Excel-lent Graphing to Add to Your Digital Learning Resources?
Let’s Go Paperless!
This digital, paperless Easter Fruit Snacks Data Collection and Excel Graphing Activity
can be an engaging way to:
* integrate math, technology, and Next Generation Science and Engineering Practices
* extend and enrich a math topic of study
* introduce or give students additional practice creating sheets and charts using Excel
* give students a real, personal, and unique way to compare data that’s fun and delicious!
I originally created this Excel data collection and graphing activity as a way to integrate technology into my Math classes, extending and enriching instruction.
Teachers and families are facing new challenges as we all find our way to provide
meaningful, digital, paperless learning experiences with the changes COVID-19 has
brought to our interactions.
I revised and updated my paper directions to continue to showcase student
confidence and competence using available technology in a digital way.
This classroom-tested product file includes:
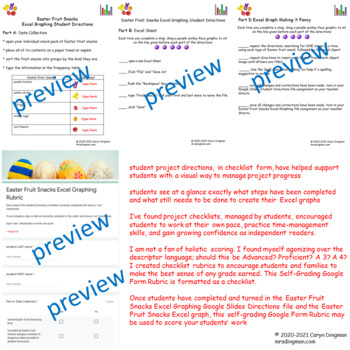
* Easter Fruit Snacks Data Collection and Excel Graphing Activity Student Directions,
with a checklist format using Google Slides, to be able to share with your students
through Google Classroom, Schoology, etc.
* Directions to explain how to copy the Student Directions into your own Google
Drive - this process does NOT need TPT to have access to your Google Drive
* Step-by-Step Directions for using Excel to create the Easter Fruit Snacks Graph, to
display for students during a Zoom, Google, or Microsoft Teams meeting, or on your Smartboard in the classroom
* Rubric, using a self-grading Google Form, to be able to grade each of your
student’s graphs
* Teacher management suggestions based on my classroom experiences using this graphing project
* The checklist format of the project directions is meant to encourage you to have students work in small, manageable bits of time. Ask your students to spend about 10-15 minutes at a time, over a number of days, following the project steps until it is completed.
* The checklist format will help your student know exactly what steps were completed and what steps still need to be done.
* I’ve used this project with younger students, or students needing adaptations, in small groups as well; reading the project checklist directions aloud to those small groups for a 10 or 15-minute rotating center turn. This adaptation can be managed in a virtual learning setting as well.
* The Easter fruit snack pouches are 0.5 ounces. Your student can use the data from 1 or 2 fruit snack pouches to graph as desired. The brand I purchased was Welch’s.
* After making any corrections or edits as needed, teachers could save each student’s Excel graph in pdf form. Create a digital class book to showcase these beauties and share with families electronically! A strong home-to-school connection can still be maintained in a virtual learning platform.


