74 results
Statistics Common Core 1.MD.C.4 resources
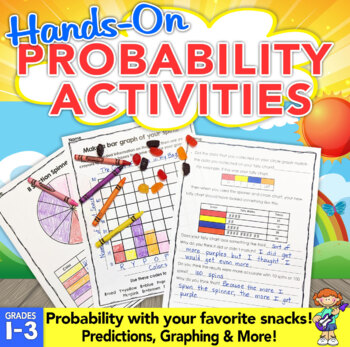
Probability Activities: Hands-On Probability with Snacks!
Probability activities are fun and engaging when you add treats! These fun probability activities allow students to experiment with probability using snacks.Students will use probability to predict, investigate, record data, and learn to use words to describe the chances of something happening.Students will love these probability activities because they are using skills with snacks! Each of the probability activities builds on each other and guides them step-by-step. Easy prep to print off the p
Subjects:
Grades:
1st - 3rd
Types:
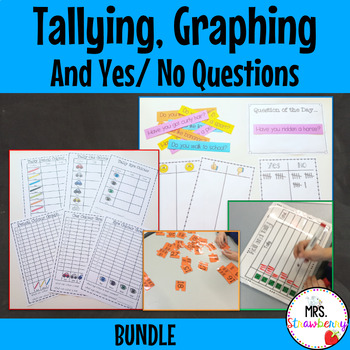
Tallying Graphing and Yes No Questions Statistics and Data Bundle
This bundle combines my three tallying and graphing products. You will find all you need to teach and practise using tally marks and graphing with these fun tallying games and activities.Includes:1. Tally Number Match Puzzle- Students match the numbers 1-30 with the correct tally marks. Includes black and white and colour versions.2. Roll and Tally Game - Roll the dice and place a tally next to each number as it is rolled. Includes black and white and colour versions.3. Tally Charts, Graphs and
Subjects:
Grades:
PreK - 1st
Types:
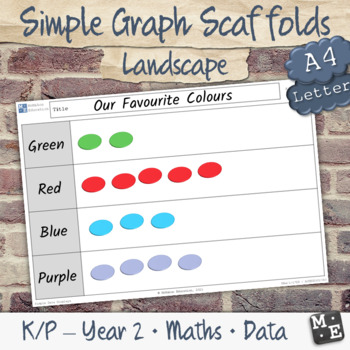
GRAPHING DATA Simple Picture Column Bar Graph Blank Scaffolds (Landscape)
Introduce students to arranging and representing data in rows or columns, with these printable graph scaffolds.By using these scaffolds students will:Use concrete materials, pictures or drawings as symbols to create data displays with one-to-one correspondenceGroup objects according to certain characteristicsArrange objects in rows or columns to form data displaysInterpret information presented on each data displayThis resource contains blank, A4/letter size scaffolds in landscape orientations:2
Subjects:
Grades:
K - 2nd
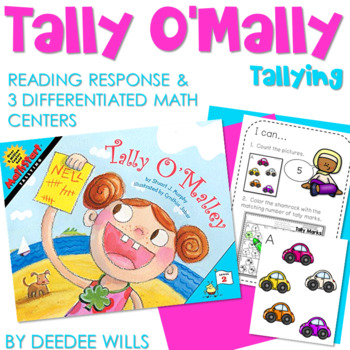
Tally Marks Center & Math Read Aloud Response - Tally O'Mally
Looking for differentiated tally marks math centers? Then you are in the right place. This set of math read-aloud responses and math centers coordinate perfectly with the book, Tally O'Mally by Stuart Murphy.HOW TO USE THIS SET OF MATH ACTIVITIES:Read the book, Tally O'Mally by Stuart Murphy, then ask students to demonstrate understanding of tally marks with the enclosed response page. Add the differentiated math center where students will be working with tally marks. You can decide which ac
Subjects:
Grades:
K - 1st
Types:
CCSS:
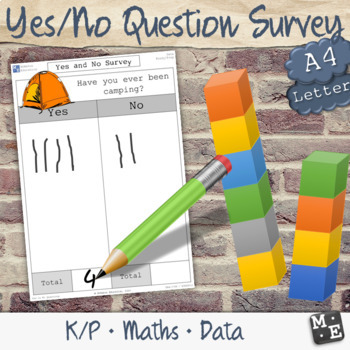
COLLECTING DATA Yes and No Survey Questions Worksheets
Get your students up and about as they conduct simple Yes and No surveys, gather and record factual data to build a source of information about the themselves and others in their immediate environment. These printable worksheets will provide a suitable scaffold with interesting and fun questions, that will prompt interpretive discussion about the similarities and differences between peer personalities and traits.By using these worksheets, students will collect information about themselves and th
Subjects:
Grades:
K
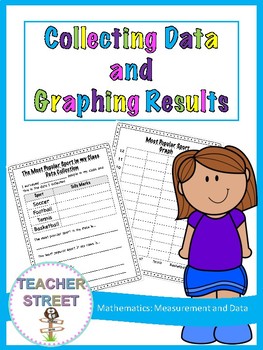
Collecting Data and Graphing Results
Have your students work through the process of collecting, representing and analyzing data.
This pack includes templates for the following topics;
Most Common Pet
Most Popular Sport
Favourite Fruit
Most Popular Book
Favourite Subject
Favourite Shape
Number of Siblings
+ a blank template for students to choose their own topic.
You might like your students to complete all the topics or simply allow them to choose a couple they are interested in.
Each graph comes in two versions.
Numbered up t
Subjects:
Grades:
1st - 3rd
Types:
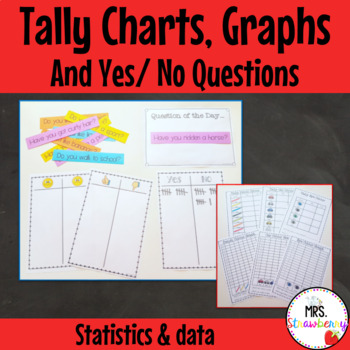
Tally Charts Graphs and Yes No Questions Package
This package includes:3 Yes/ No Tally Charts - for recording and tallying responses to yes/ no questionsQuestion of the Day Poster - to display the question of the day15 Sample Questions of the Day - to be displayed on the Question of the Day poster3 Tallying worksheets - Tallying pencil color, car color and eye color. Each worksheet is provided with a color and black & white version. Also includes Australian and US spelling options.3 Graphing worksheets - Graphing pencil color, car colour a
Subjects:
Grades:
PreK - 1st
Types:
Also included in: Tallying Graphing and Yes No Questions Statistics and Data Bundle
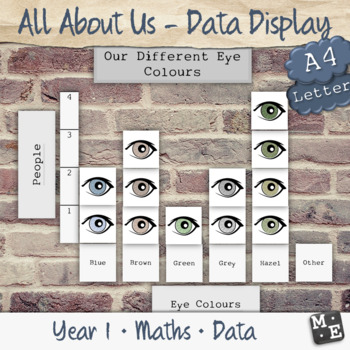
GRAPHING DATA Whole Class Gather and Represent Printable Picture Wall Display
Immerse your students in the process of representing their personal traits and characteristics as discrete data points, with this whole class printable data display. Simply choose from the selection of topics, ask students to represent their own self by colouring one of the corresponding data points, then invite them to add their picture to the bar or column graph (your choice) to represent the range of responses of the whole class.Through participation, students will:investigate a matter of int
Subjects:
Grades:
K - 2nd
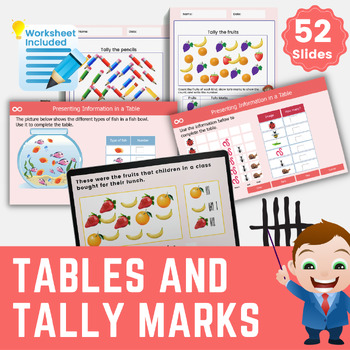
Tables and Tally Charts First Grade Interactive Activities CCSS.1.MD.C.4
This amazing completely interactive lesson with differentiated activities will allow 1st-grade class to interpret and construct simple tally charts and tables. Based on the first grade Common Core State Standards for interpreting and measuring data.Teachers can use the lesson for whole-class teaching as well as at home by learners.There are lots of drag and drop tally charts activities with instant feedback.The lesson contains 52 interactive pages as well as lots of differentiated activities. An
Subjects:
Grades:
1st - 2nd
CCSS:
Also included in: Data and Graphing Activities and Worksheets for First Grade
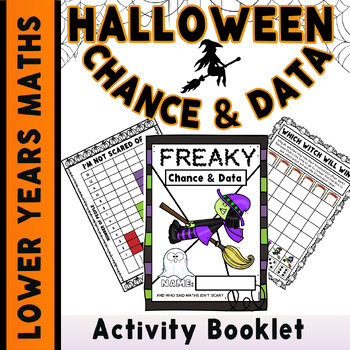
Halloween Maths Activity Booklet Lower Years Data & Chance Maths Activities
A booklet created for the lower years to complete full of freaky and fun maths activities that are Halloween themed and feel more like fun games to complete than learning! No Prep Required - Just Print and Go! Black and White or Color Options Available Complete over one day (whilst recovering from the candy high) or over the week of Halloween to celebrate! Activities Included in BookletData Activities Reading TalliesCounting Tallies Recording using Tallies Mixing and Matching Tallies to Numerals
Subjects:
Grades:
K - 2nd
Data Analysis & Probability: Word Problems Vol. 1 Gr. PK-2
**This is the chapter slice "Word Problems Vol. 1 Gr. PK-2" from the full lesson plan "Data Analysis & Probability"** About the FULL RESOURCE:For grades PK-2, our resource meets the data analysis & probability concepts addressed by the NCTM standards and encourages your students to learn and review the concepts in unique ways. Each task sheet is organized around a central problem taken from real-life experiences of the students. The pages of this resource contain a variety of content and
Grades:
PreK - 2nd
Types:
Data Analysis & Probability - Drill Sheets Gr. PK-2
Explore probabilities and start comprehending data that has been collected. Our resource provides warm-up and timed drill activities to practice procedural proficiency skills. The drill sheets provide a leveled approach to learning, starting with prekindergarten and increasing in difficulty to grade 2.About this Resource:Count the number of chickens on a farm using a bar graph. Find how many more roses than tulips are in a garden from a circle graph. Identify the likelihood of choosing a color
Subjects:
Grades:
PreK - 2nd
Types:
Also included in: Five Strands of Math - Drills BIG BOOK - BUNDLE Gr. PK-2
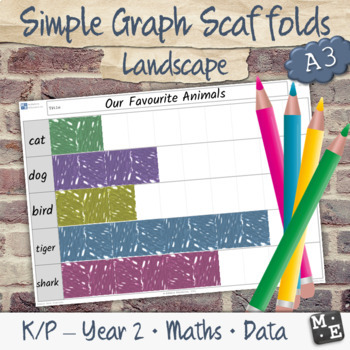
GRAPHING DATA Simple Picture Column Bar Graph Blank Scaffolds (A3 Landscape)
Introduce students to arranging and representing data in columns, with these printable graph scaffolds.By using these scaffolds students will:Use concrete materials, pictures or drawings as symbols to create data displays with one-to-one correspondenceGroup objects according to certain characteristicsArrange objects in rows or columns to form data displaysInterpret information presented on each data displayThis resource contains blank, A3 size scaffolds in landscape orientations:2,3,4,5,6,7, and
Subjects:
Grades:
K - 2nd
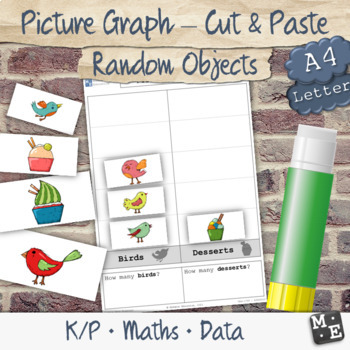
GRAPHING DATA Random Objects Picture Graph Cut and Paste Worksheets
Allow students to practice grouping and organising objects into simple column graphs with these differentiated cut and paste worksheet activities. Random objects are presented so that students can easily catergorise them according to their extremely dissimilar features.By completing this activity, students will be able to identify, classify and group objects according to their characteristics. They will arrange these objects into columns to form a simple data display. They will implement their c
Subjects:
Grades:
K - 1st
Types:
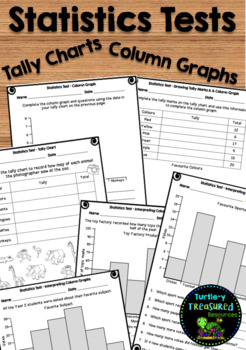
Statistics Tests - Differentiated - Tally Charts and Column Graphs
This test was designed for Year 1-3 students based on the statistics strand of the Australian Curriculum. It will also suit other curriculums as well. AUS and US spellings included.5 tests are included (7 pages):Drawing tally charts & column graphs test - Counting in 1s - 2 pagesDrawing tally charts & column graphs test - Counting in 2s - 1 pageInterpreting column graphs test - Counting in 2s - 1 pageInterpreting column graphs test - Counting in 5s - 1 pageInterpreting column graphs test
Subjects:
Grades:
1st - 3rd
Types:
Also included in: Maths Test Mega Bundle - Year 2
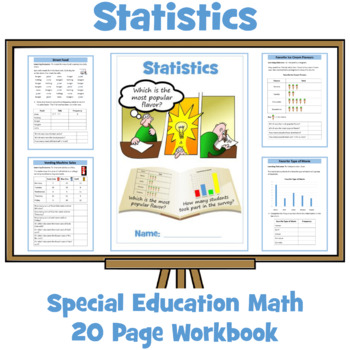
Statistics Workbook - Special Education Math
This math resource has been designed for older Special Education students working at grades 1-2. It contains an age-appropriate, 20-page workbook (20 worksheets) with progress check, certificate of achievement on statistics. Tasks and activities have been designed to achieve the following outcomes:Sort and classify objects using more than one criterionCollect information by surveyRecord results in lists, tally charts, and tablesConstruct and interpret pictograms where one picture represents one
Subjects:
Grades:
Not Grade Specific
Types:
Data Analysis & Probability - Drill Sheets Vol. 1 Gr. PK-2
**This is the chapter slice "Drill Sheets Vol. 1 Gr. PK-2" from the full lesson plan "Data Analysis & Probability"** About the FULL RESOURCE:For grades PK-2, our resource meets the data analysis & probability concepts addressed by the NCTM standards and encourages the students to review the concepts in unique ways. Each drill sheet contains warm-up and timed drill activities for the student to practice data analysis & probability concepts. The pages of this resource contain a variety
Grades:
PreK - 2nd
Types:
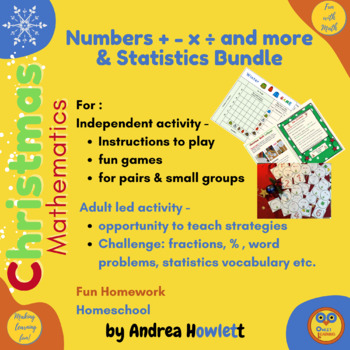
Christmas Statistics & Number Bundle
Statistics resources - the Christmas and winter resources will create fun for math games to learn about how to fill in a statistic graph such as a bar graph, tally chart and picture graph. The statistics table can then be used to interpret data and answer simple questions and students can also use this to make up their own challenging questions for example about the statistics range etc. The data generated - by using dice with cute clipart - will differ from one game to another, so will be rel
Grades:
K - 3rd
Types:
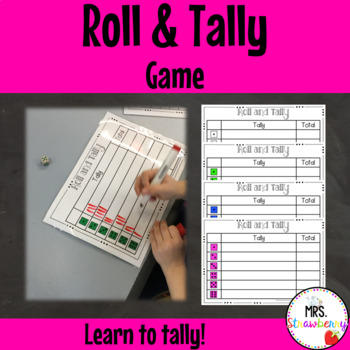
Roll and Tally Game
Roll the dice and place a tally next to each number as it is rolled.This is a great game for small groups or centres to practice tallying. Let your students practice counting tallies so they can easily collect and interpret data during Statistics lessons.Includes black and white and colour versions.This product is included in a BUNDLE with other tallying activities perfect for your Kindergarten, Prep or Grade 1 class here: Tallying and Yes/ No Questions BundleYou might also like:Tally Number Mat
Subjects:
Grades:
PreK - 1st
Types:
Also included in: Tallying Graphing and Yes No Questions Statistics and Data Bundle
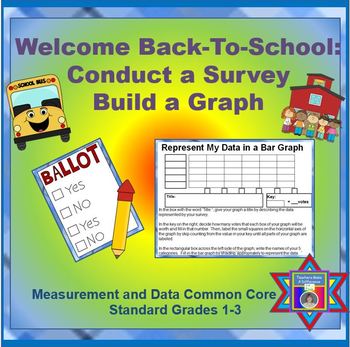
Graphs FREEBIE Back-To-School: Conduct a Survey & Build a Graph (CCSS Aligned)
FREE!!! FREE!!! FREE!!! FREE!!! FREE!!! FREE!!! FREE!!!
PLEASE take time to provide feedback in exchange for the download! I appreciate your time!
I created what I hope to be a fun but helpful resource for your students in Grades 1-3. In return, I ask that you please take time to rate and leave feedback to let others know how the activity worked for you and your students. I appreciate your time and effort!
In Grades 1-3, students are expected to be able to build their own bar
Grades:
1st - 3rd
Types:
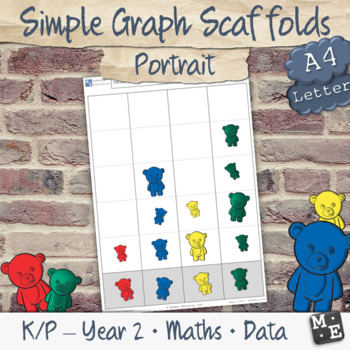
GRAPHING DATA Simple Picture Column Graph Blank Scaffolds (Portrait)
Introduce students to arranging and representing data in columns, with these printable graph scaffolds.By using these scaffolds students will:Use concrete materials, pictures or drawings as symbols to create data displays with one-to-one correspondenceGroup objects according to certain characteristicsArrange objects in rows or columns to form data displaysInterpret information presented on each data displayThis resource contains blank, A4/letter size scaffolds in portrait orientations:2, 3, 4 an
Subjects:
Grades:
K - 2nd
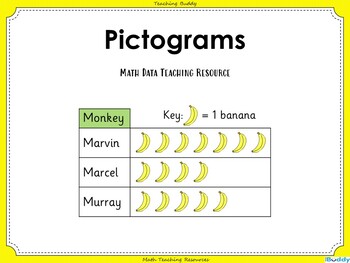
Pictograms
PictogramsIn this math teaching resource, students practice drawing and interpreting pictograms where the picture represents 1, 2, 5 or 10. Content includes:PowerPoint presentationActivities to support the teaching of this objective with six accompanying worksheetsThree further differentiated worksheets with answers'Pictograms' can be edited so you are able to adapt the resource for each class you teach.Click on the preview to see some example slides from 'Pictograms'.
Subjects:
Grades:
K - 2nd
CCSS:
Also included in: Introduction to Statistics Bundle
Data Analysis & Probability - Task & Drill Sheets Gr. PK-2 - Distance Learning
Get introduced to probabilities while reading and understanding information in graphs. Our resource introduces the mathematical concepts taken from real-life experiences, and provides warm-up and timed practice questions to strengthen procedural proficiency skills. The task and drill sheets provide a leveled approach to learning, starting with prekindergarten and increasing in difficulty to grade 2.About this Resource:Gather information first hand by finding out which month has the most birthda
Subjects:
Grades:
PreK - 2nd
Types:
Data and Graphing Activities and Worksheets for First Grade
Data and Graphing Activities and Worksheets for First GradeIntroduce your 1st grade students to data and graphing, including sorting items into groups, tally marks and tally sheets, pictographs, and bar charts. Engage your 1st-grade class with these amazing Data and Graphing Activities and Worksheets for First Grade. A fun-packed interactive math lesson bundle for your grade 1 learners. Buy this great value bundle of interactive lessons today to save you hours of planning and don't forget to lea
Subjects:
Grades:
1st - 2nd
CCSS:
Showing 1-24 of 74 results


