34 results
Graphing Common Core 4.MD.B.4 resources for Microsoft PowerPoint
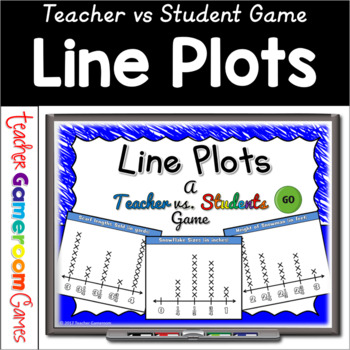
Teacher vs Student - Line Plots Powerpoint Game
Engage students with this fun, interactive line plot game. Students answer questions about 3 winter themed line plots. Questions include most/least favorites, totals for each group, and comparing groups. There are 3 graphs in this game, each with 7 questions, giving you a total of 20 questions (including a tie breaker). You just click on each question to go to it. The question disappears after you've clicked on it so you know you've answered it. There are 2 scoreboards: a touch scoreboard and t
Subjects:
Grades:
2nd - 5th
Also included in: Graphs Bundle | No Prep Digital Resources
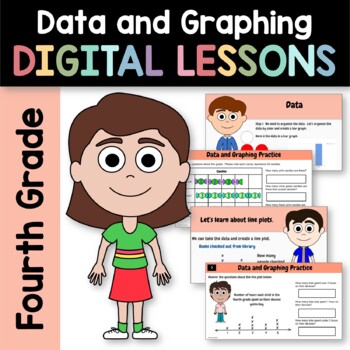
Data and Graphing 4th Grade Interactive Google Slides | Math Skills Review
Teach data and graphing for fourth grade with these two interactive digital Google Slides Presentations. What's included? One Google Slides interactive presentation with 43 slides that teaches about data and graphingOne Google Slides interactive presentation with 10 slides where students can practice more by moving objects, entering answers, filling color, and more, all digitallyPowerPoint presentations of same contentPDF versions of same contentAnswer keysInstructions for setting up your Google
Subjects:
Grades:
3rd - 5th
CCSS:
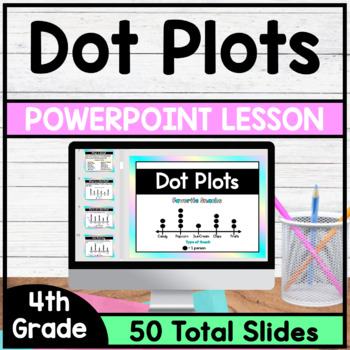
Dot Plots - PowerPoint Lesson
This is a PowerPoint Lesson that focuses on Dot Plots. This PowerPoint Lesson goes through the complete lesson plan cycle. In this lesson students will learn about the parts of a dot plot and will understand how to summarize data on a dot plot. *This PowerPoint Lesson has everything you need to teach a lesson. Just download and begin teaching. This lesson includes Direct Instruction Slides, Guided Practice Slides and Independent Practice Slides. (Printable Version of Guided Practice Questions
Grades:
4th
CCSS:
Also included in: 4th Grade Math PowerPoint Lessons - Bundle
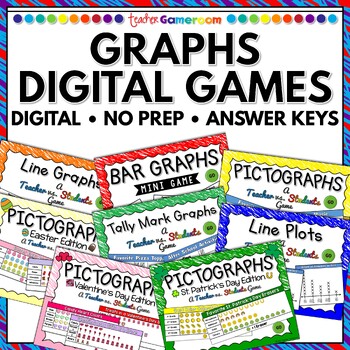
Graphs Bundle | No Prep Digital Resources
8 digital graphing games for one price. Graphs include Bar graphs, picture graphs, line graphs, line plots and more! Each digital game is ready to play immediately. No prep. Simply make this one-time purchase and you're ready to start off your science year great! Download games from my store as soon as they are available. This bundle is an EVERGROWING BUNDLE meaning any science game I make in future will automatically be added to this bundle! Games included:⭐️ Bar Graphs - Mini Game⭐️ Line Graph
Subjects:
Grades:
K - 5th
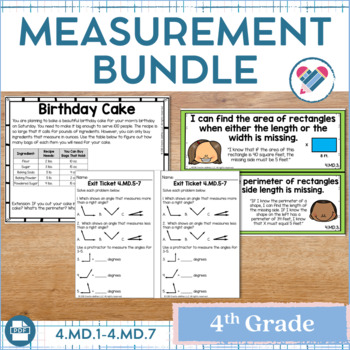
Measurement Bundle 4th Grade
This bundle is the perfect tool to teach your students the measurement standards in the common core. By completing the activities in this set, your students will understand how to convert units, solve measurement word problems, find the area and perimeter of shapes, create line plots, and draw and measure angles. Included in This Download:• 25 Math Tasks for cooperative learning• 26 Exit Tickets for individual assessment• I can statements for clear learning objectives• 7 formative assessmentsCom
Subjects:
Grades:
4th
Types:
Grade 4 Envisions Math 2.0 Version 2016 Topic 11 Inspired Power Point Lessons
Teach impressive lessons in person or through distance learning about line plots with Grade 4 EnVisions Math 2016 Version Topic 11 Power Point lessons! These Common Core aligned lessons allow you to integrate technology into your instruction and use the Common Core based EnVisions skills and terminology to help your students master the skills. For distance learning, you can teach virtual lessons using a shared screen, or break these apart into individual lessons and download them as Google slid
Subjects:
Grades:
4th
MATH GRAPHS & DATA Introduction to Various Graph Types PowerPoint PPT
This is a 36-slide PowerPoint presentation that provides the following information:
1. graphing vocabulary (data, scale, axis, interval, range, outlier);
2. definitions of and examples of 8 types of graphs (bar graph, double bar graph, line graph, line plot, stem-and-leaf plot, circle (pie) graph, pictograph, and histogram); and
3. a practice slide (with an answer slide to follow) for each type of graph.
Enjoy!
Deanne Davis, MCPSS
Subjects:
Grades:
3rd - 9th
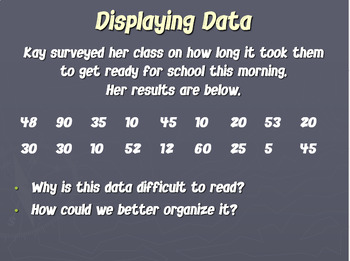
4th 5th 6th Grade Math Data Analysis Measurement Stem Leaf Plot MD DP Gr 4 5 6
This PowerPoint discusses numerical and categorical data. It has several problems to organize into stem and leaf plots. It addresses the following 4th and 6th grade Common Core standards: 4.MD.B.4 and 6.SP.B5. It also aligns to the Florida B.E.S.T. Benchmarks for 4th and 5th grade: MA.4.DP.1.1 and MA.5.DP.1.1.Please note that this PowerPoint uses whole numbers only because it's intention is to be used to introduce/review the concept of Stem and Leaf plots. Additional resources should be used to
Subjects:
Grades:
4th - 6th
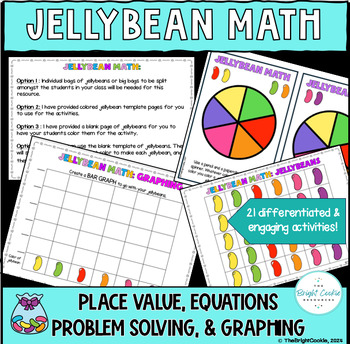
Jellybean Math: K-4th grade - Place Value, Graphing, Problem Solving, Fractions
This resource includes 31 pages and 10 differentiated and engaging activities. All the activities/pages in this resource are standards based. You can use this in spring around Easter (however, it isn’t not Easter related), or ANY time in the year in which you want to review graphing, place value, problem solving, equations/computation, and fractions. This product can be used as stations OR whole group activities. *If you would like to use real jellybeans for this activity, GO FOR IT! (We all kno
Subjects:
Grades:
K - 4th
Types:
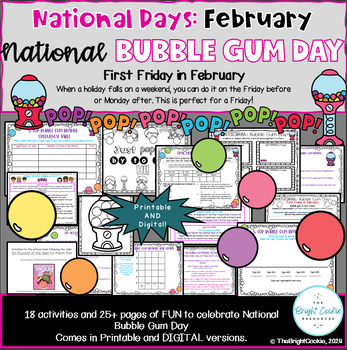
National Bubble Gum Day: Feb. 2nd- Differentiated Math and Engaging Activities
National Bubble Gum Day is celebrated on the first Friday of every February. What a great way to implement some academics AND ENGAGING FUN by using this National Bubble Gum Day resource that provides 18 activities with 25+ pages in all. Both printable and digital versions are provided for most activities. Additional resources with the picture book companion: On the Account of the Gum by Adam Rex)This resource includes: · What is National Bubble Gum Day? Page· Bubble Gum Timeline page· World Rec
Subjects:
Grades:
Not Grade Specific
Types:
Also included in: February National Days: BUNDLE- Engaging and Differentiated FUN!
EnVisions Math 2024 Grade 4 Topic 11 Inspired Power Point Lessons
Teach impressive lessons in person or through distance learning about line plots with Grade 4 EnVisions Math 2024 Version Topic 11 Inspired Power Point lessons! These Common Core aligned lessons allow you to integrate technology into your instruction and use the Common Core based EnVisions skills and terminology to help your students master the skills. For distance learning, you can teach virtual lessons using a shared screen, or break these apart into individual lessons and download them as Goo
Subjects:
Grades:
4th
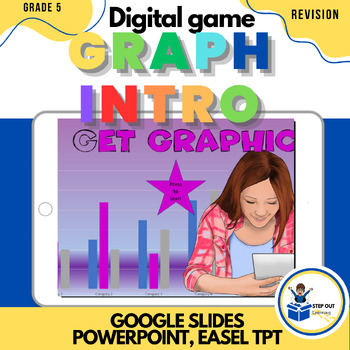
Math digital game - basic graphs - 20 self correcting MCQs with worksheet
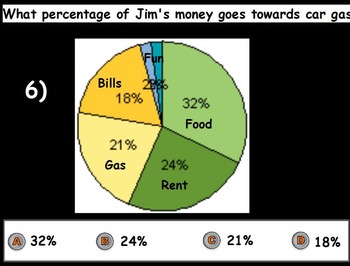
Test a student's understanding of basic graphs - pie charts, bar graph, straight line graph, bar charts. There are four interactive activities (20 questions) to complete. Each activity will test for understanding and application of the concept. The colorful game is self-correcting, providing feedback after each activity. All activities must be completed to win the game. Students succeed and track their progress as they complete each activity on the supplied worksheet. Correct answers are reward
Grades:
4th - 5th
Types:

Types of Graphs Slides
The powerpoint goes through many different types of charts and graphs, how to create them, and the different aspects. It also includes real-world examples and opportunities for practice. Charts and Graphs covered in Powerpoint:Tally ChartLine PlotPictographBar Graph
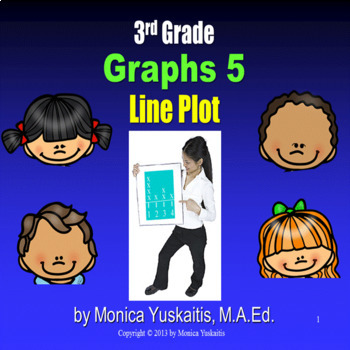
3rd Grade Graphs 5 - Line Plots Powerpoint Lesson
Third Grade Graphs 5 - Line Plots - This is perfect for distance learning on Zoom or similar formats. On top of that it is powerful when used as direct instruction in the classroom. It introduces the students to line plots. The following concepts are taught: grid, graph, coordinates, axes, scale, interval, title, and key. There are 22 strategies of effective teaching based on research in this powerpoint lesson. For best results, students should have white boards and dry erase markers. I
Subjects:
Grades:
3rd - 4th, Adult Education
Also included in: 3rd Grade Graphs Bundle - 6 Powerpoint Lessons - 277 Slides
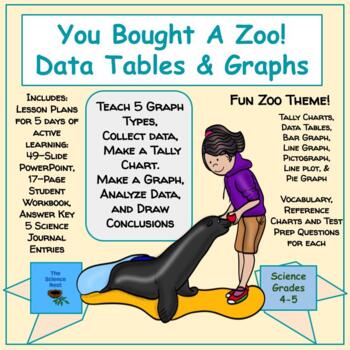
You Bought A Zoo! Data Tables & Graphs
Young scientists learn the importance of graphing in science to display data, for the purpose of analysis and drawing conclusions for future actions. Students in Grade 4 and Grade 5 complete five fun, hands-on lessons to collect real-time data, read tally charts and data tables, make graphs, and draw conclusions, to make decisions and to answer questions about their own brand new zoo.Use part of the 49-slide PowerPoint each day to introduce different graphs and the purpose of each. The 17-pag
4.MD.4 Dot Plots Activity: Paper Airplane Challenge
This resource is an interactive whole class activity where students gain real world experience collecting data and interpreting it on dot plots. (4.MD.4)This product includes two parts:An interactive google slides presentation with an engagement hook and guiding questions.Student data collecting sheet and dot plot organizerTeacher Instructions are also included in this resource to help facilitate an entire lesson.Skills practiced in this activity:Collecting dataGraphing data on a dot plotUsing d
Subjects:
Grades:
4th - 8th
CCSS:

Distance Learning - Data - Stem and Leaf, Dot Plots, and Frequency Tables
PRODUCT OVERVIEW: This is a TRUE distance learning resource for students working away from the classroom OR on their own. Can also be used for reteaching or in other whole or small group settings.No need to print anything! Resource covers frequency tables, dot plots, and stem-and-leaf plots.If you would like a Google Classroom version of this resource, check out this product: Distance Learning - Data - Stem and Leaf, Dot Plots, and Frequency Tables. What’s Included?Product Overview document (PD
Subjects:
Grades:
4th - 5th
CCSS:
Creating Line Plots- 4.MD.4a
This lesson covers the CCSS 4.MD.4. It teaches students how to interpret and create line plots with the help of fun characters. I have used this lesson with my students and it includes teaching slides, guided practice, independent practice and a short quiz at the end to check for understanding. Great for use in a whole class setting or for tutoring purposes.
Subjects:
Grades:
4th - 6th
Types:
CCSS:
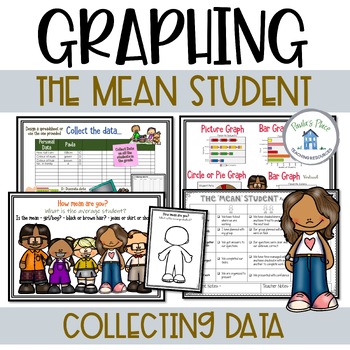
Graphing the Mean | Your Mean Student - Project Based Learning
Graphing the Mean - Your students will experience a math task that will lead to a group presentation. They will compose questions, collect data, collate data, determine the ‘mean’, show the data in various graphs and design a poster to present the ‘mean student’.Slides include-What the unit will cover-How mean are you? What will you be looking for?-What is the mean?-How mean are you?-Template for recording the mean student-Ideas for recording data-Group guidelines – it’s your turn-Types of graph
Subjects:
Grades:
4th - 6th

Fourth Grade Data Analysis Notebook (Print and Digital)
Printable and digital versions for Powerpoint, Google Slides, and SeeSaw included!! Flipping through Math Data Analysis includes SIX different activities that your students can complete for independent practice, review, or assessment. There is a two-page (or one, copied front to back) activity for each skill:1. Creating Frequency Tables and Dot Plots2. Analyzing Frequency Tables and Dot Plots3. Frequency Tables and Dot Plots with Fractions and Decimals4. Creating Stem and Leaf Plots5. Analyzing
Subjects:
Grades:
3rd - 5th
CCSS:
Also included in: Fourth Grade Math Notebooks (Print and Digital) - BUNDLE
Line Plots- Create & Analyze Line Plots Lesson (4.MD.B.4) Google Slides
Complete Google Slide Lesson - 4th Grade Line Plots (4.MD.B.4)*This engaging lesson requires no prep*This digital resource includes 14 slides that teaches students how to analyze and plot data on a line plot. It also covers how to analyze and plot fractions on a line plot. Students will be provided various data to use to create a line plot and question to help them analyze the data.
Subjects:
Grades:
4th
Types:
CCSS:
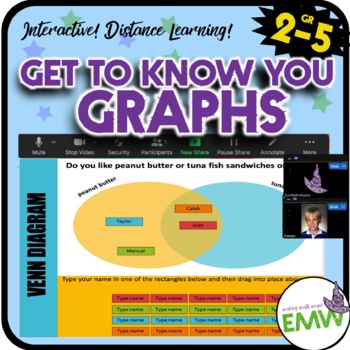
Distance Learning Back to School Get to Know You Graphs
This editable PowerPoint slide deck provides everything you need to help your students get to know each other as well as create graphs (bar chart, line plot, line chart, pie chart, and Venn diagram) with the data. Perfect for distance learning. You can also open this into Google Slides.Back to School Get to Know You Graphs Line plot, pie chart, Venn, etc.How can I use this for Distance Learning?You open this file. Read through all the tips and notes. Make any changes and adaptions you need for
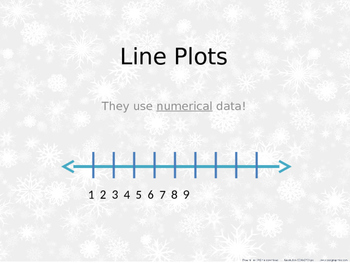
Line Plots
This PowerPoint presentation explains what a line plot is with examples and also covers mode and range on the graph. There is also a blank line plot included for the class to create their own data set by doing sit-ups! This PPT can be customized and edited to fit your students' needs.
Subjects:
Grades:
2nd - 5th
Types:
Basic Math Skills - Graphing Skills (worksheet included) (POWERPOINT)
This zip file contains a lesson on GRAPHING and BASIC GRAPHING SKILLS; the file contains all the materials necessary to teach the lesson, including a 25 slide Powerpoint lesson and a 3 page worksheet for the students that coincide with the Powerpoint lesson. The math involved is basic and was geared toward a special education class. However this lesson would be still useful to elementary or middle school level general education classes. . Along with the lesson material, this lesson includes a
Subjects:
Grades:
3rd - 6th
Showing 1-24 of 34 results


