National Bubble Gum Day: Feb. 2nd- Differentiated Math and Engaging Activities
- PPTX
- Google Apps™

Also included in
- This BUNDLE INCLUDES:National Bubblegum Day_Feb. 2National Kite Flying Day_Feb. 8National Susan B. Anthony Day_Feb. 15National Be Humble Day_ Feb. 22ndProduct Descriptions Below:National Bubble Gum Day is celebrated on the first Friday of every February. What a great way to implement some academicsPrice $10.00Original Price $15.00Save $5.00
Description
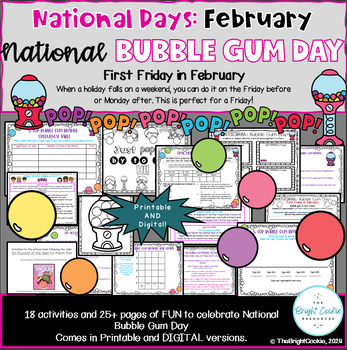
National Bubble Gum Day is celebrated on the first Friday of every February. What a great way to implement some academics AND ENGAGING FUN by using this National Bubble Gum Day resource that provides 18 activities with 25+ pages in all. Both printable and digital versions are provided for most activities.
Additional resources with the picture book companion: On the Account of the Gum by Adam Rex)
This resource includes:
· What is National Bubble Gum Day? Page
· Bubble Gum Timeline page
· World Record Bubble Blowing Activity
· Voting page
· Top Bubble Gum Brands Info page
GRAPHING:
5 TOP BRANDS resources:
-5 top brands (brands provided in graph) frequency table- students will use tally marks to record how many times a certain gum is voted for.
· 5 top brands- BLANK frequency table
· Blank bar graph to graph the 5 top brands using the frequency table.
· Dot pot to graph the 5 types of gum.
3 TOP BRANDS resources:
· 3 top brands (brands provided in graph) frequency table- students use tally marks to record how many times a certain gum is voted for.
· 3 top brands- BLANK frequency table
· Blank bar graph to graph the 3 top brands using the frequency table.
· Dot pot to graph the 3 types of gum.
· Data questions that go with both 3 and 5 types of gum graph data - printable AND DIGITAL
FRACTIONS:
· For older students: Fraction Data questions- printable AND DIGITAL
· Answer Key for Fraction questions
CREATIVE WRITING PROMPTS:
· “Sticky Situation” writing prompt (with definition and discussion prompt)- comes in blank, lined, and digital versions provided.
· “Create your own flavor of gum” prompt and creative activity- blank, lined, and digital versions provided.
· “Just Poppin’ By”-Note of encouragement cards.
· Coloring page
· Blank bubble gum jar with gumballs template- teacher can use this in many ways: You could have them write adjectives to describe something, vivid verbs, all the proper nouns they read in a story, compliments to a friend, ways to help each other, the answers to a math problem page, etc.
On Account of the Gum is a book about how the best intentions lead to some of the worst (and funniest) ideas! Serious humor abounds in this story about one kid's hilarious misadventures with gum, and the cumulative buildup of stuff stuck in hair.
On Account of the Gum by Adam Rex picture book-
· Question page
· Writing prompt
**MORE NATIONAL DAYS resources are coming! There will be a bundle when all have been posted. As of right now, probably 4-5 National Days in the February Pack.
KEY WORDS: National Days, February National Days, February, Chewing Gum, Bubble-Gum, Bubble-gum activities, chewing gum activities, creative writing, graphing, dot plot, bar graph, frequency table, fractions, coloring, creativity, problem solution


