21 results
Graphing Common Core 4.MD.B.4 resources for Easel
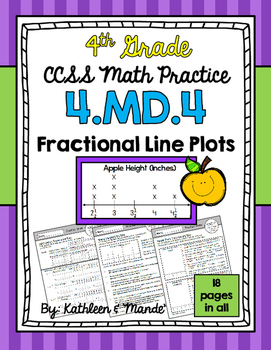
4.MD.4 Practice Sheets: Fractional Line Plots
This 4.MD.4 CCSS aligned packet includes 18 practice sheets to teach/reinforce line plots with whole numbers, fractions, and mixed numbers. These sheets can be used to introduce a concept, review a concept, or send home as reinforcement for homework. **An answer key is provided.- - - - - - - - - - - - - - - - - - - - - - - - - - - - - - - - - - - - - - - - - - - - - - - - - - - - - - - - - - - - - - - - - - -This resource can be used along with our other 4.MD.4 resources:4.MD.4 Task Cards: Set 1
Subjects:
Grades:
3rd - 5th
Types:
Also included in: 4.MD.4 BUNDLE: Fractional Line Plots
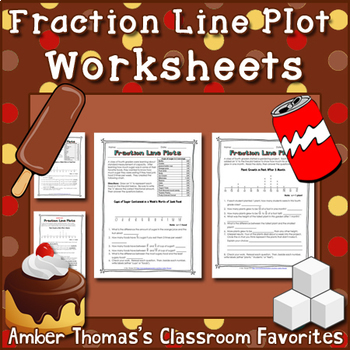
Fraction Line Plot Worksheets
Do your students need more practice learning to make a line plot to display a data set of measurements in fractions of a unit? I know when I went over the Common Core Standards CCSS Math 4.MD.B.4 had me scratching my head. We had NO resources to cover it. So I made my own! These two worksheets use contexts that fourth graders are likely to be familiar with when it comes to measurement units and fractional parts. The types of questions vary between reading a line plot, creating a line plot wi
Subjects:
Grades:
4th - 5th
Types:
Also included in: Fraction Line Plot Bundle
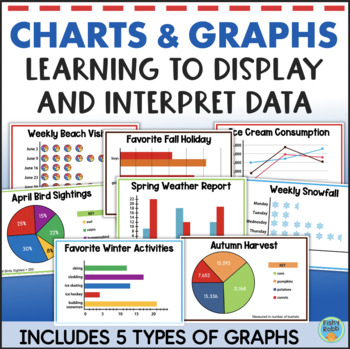
Math Graphing Activities Interpreting Graphs and Data Worksheets Line Pie Bar
Representing and interpreting data using graphs and charts is the focus of this math resource for upper elementary grades. It helps students explore and understand data analysis. For each activity, students will use a graph to answer questions about the data. They will also create another type of graph, chart, or table based on the information provided. This added step really helps students understand the various types of graphs and ways in which data can be displayed.These activities are perfec
Subjects:
Grades:
3rd - 5th
Types:
Also included in: Third Grade Math & Reading YEAR LONG BUNDLE 1500+ Pages
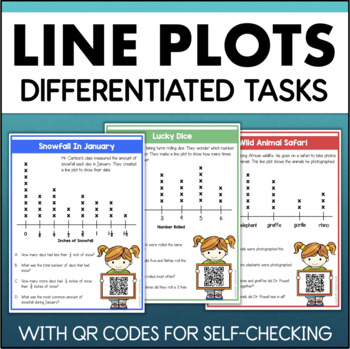
LINE PLOT Practice Activities with Fractions & Data Task Cards Worksheets
This math resource provides a scaffolded introduction to using line plots for organizing and interpreting data. The activities move from simple categorial data to more complex line plots with fractions.Each full-page card includes a data set presented in a line plot, along with 4 questions for students to answer. These questions require students to interpret and compare the data. FEATURES OF THIS RESOURCE:differentiatedability to self-checkdigital versionINCLUDES:There are 15 line plot cards div
Subjects:
Grades:
2nd - 4th
Types:
Also included in: Third Grade Math & Reading YEAR LONG BUNDLE 1500+ Pages
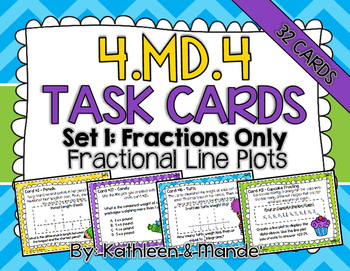
4.MD.4 Task Cards: Fractional Line Plots {Set 1: Fractions Only}
Looking for a fun, engaging way for your students to practice creating and interpreting fractional line plots? Your students will love practicing with these adorable, easy to use task cards. These 32 task cards are aligned to CCSS 4.MD.4: Fractional Line Plots.Do you want to assess the quality of our task cards before you buy? Try our {FREEBIE} 4.NF.7 Task Cards: Compare & Order Decimals. - - - - - - - - - - - - - - - - - - - - - - - - - - - - - - - - - - - - - - - - - - - - - - - - - - - -
Subjects:
Grades:
3rd - 5th
Types:
Also included in: 4.MD.4 BUNDLE: Fractional Line Plots
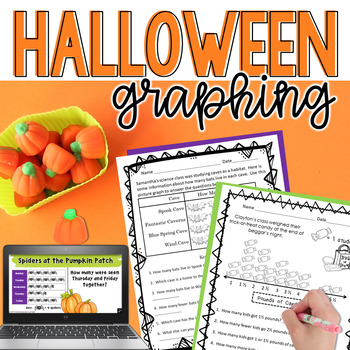
Halloween Graphing- Digital AND Printable Math Activities
Students will love creating and interpreting their own bar graphs, pictographs (picture graphs), and line plots with fractions on a number line! Printable worksheets, Digital Google Slides, and TpT Easel versions are all included in this fun Halloween Math Activity!Quickly print the Halloween math worksheets for centers, homework, morning work, bell ringers, or emergency sub plans. Or easily assign in Google Classroom or TpT Easel! Perfect for the whole month of October!Topics include Halloween
Subjects:
Grades:
3rd - 5th
Types:
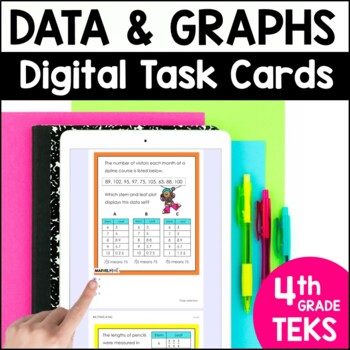
4th Grade Data Analysis, Dot Plots, Stem and Leaf Plots - Online STAAR Review
Save time with these fun and engaging Digital Task Cards for Dot Plots, Stem and Leaf Plots and Frequency Tables. These Dot Plot activities and Stem and Leaf Plot graph tasks are perfect for math centers, morning work or online STAAR review. This is a No Prep resource, to save you time!This resource includes 24 TEKS-aligned Digital Task Cards for Data Analysis and Graphs that can be assigned for Math Station Work, Homework, or online STAAR Review. This resource is included in 2 forms: a Google
Subjects:
Grades:
4th
Types:
CCSS:
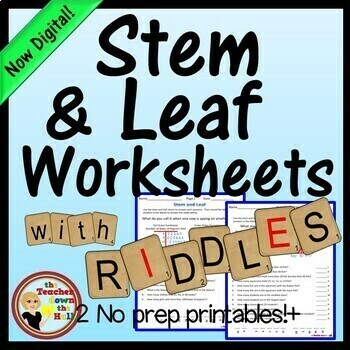
Stem and Leaf Plots Worksheets with Riddles I Data Analysis Activities
Need a fun way to practice analyzing stem and leaf plots? This is a set of 2 self-checking worksheets - each with a riddle to solve. Students will analyze stem and leaf plots to answer questions. Then they will match their correct answers to solve a riddle at the bottom of each worksheet. Use as a fun homework assignment, a self-checking independent practice, or allow students to race to find the answer to the riddle! Don't want to print? Students may now complete this assignment as an EASEL
Subjects:
Grades:
4th - 5th
Types:
CCSS:
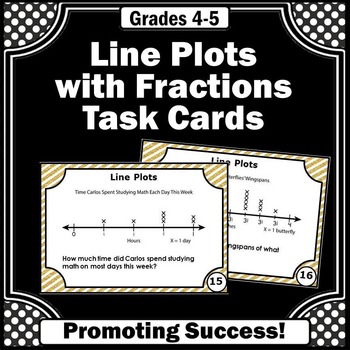
Line Plots with Fractions Review Task Cards Math Center Games 4.MD.B.4 5.MD.B.2
DIGITAL PDF AND PRINTABLE PACKET: You will download 30 math task cards for your 4th grade, 5th grade, and special education students to practice line plots with fractions. You may use the printable task cards in math centers or stations for fun practice and review games and activities, such as a scavenger hunt or SCOOT. They also work well for transition activities, as exit tickets, for morning work, and as quick formative assessments. Game ideas, a student response form and answer key are inclu
Subjects:
Grades:
4th - 5th
Types:
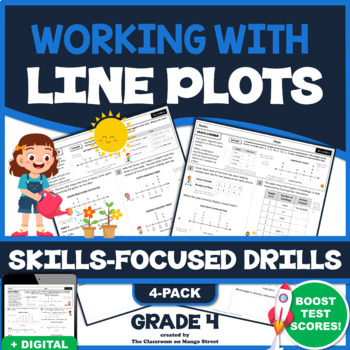
LINE PLOTS: 4 Skills-Boosting Math Worksheets | Grade 4 (4.MD.4)
NEW. Students will read and interpret data shown in line plots. They will also display and match data sets to line plots. Finally, students will solve word problems involving the addition and subtraction of fractions by using information presented in line plots. (4.MD.4). Use these guided math drills to teach and reinforce the fundamentals, or prep for test day. At the top of each worksheet is a mini-lesson followed by several Common Core designed, simulated test questions (including open
Subjects:
Grades:
4th - 5th
Types:
CCSS:
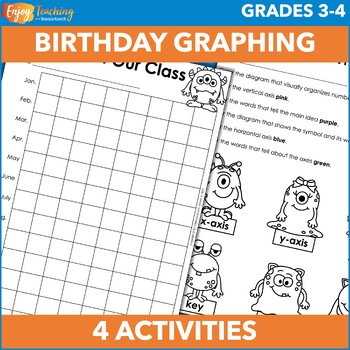
Birthday Pictograph, Bar Graph, Frequency Table & Line Plot Activities
Make graphing fun with birthdays! Together, kids create human and picture graphs. Then each child makes a bar chart. As a bonus, they can also crunch the data in frequency tables and display it on a line plot. Open the preview to take a closer look at the math activities.First, create a human graph. Ask kids to line up against a wall according to birth month. There’s only one catch: no talking! When you’re done, with a bird’s eye view, you’ve created a graph!Second, work together to build a pict
Subjects:
Grades:
3rd - 4th
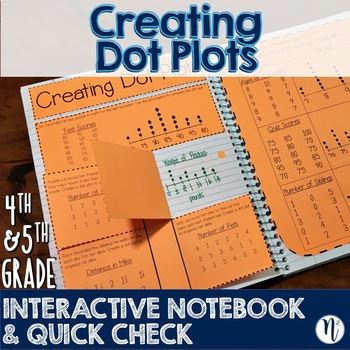
Creating Dot Plots Interactive Notebook Activity & Quick Check TEKS 4.9A & 5.9A
This interactive notebook activity and quick check assessment covers creating dot plots under TEKS 4.9A: Represent data on a frequency table, dot plot, or stem‐and‐leaf plot marked with whole numbers and fractions and TEKS 5.9A: Represent categorical data with bar graphs or frequency tables and numerical data, including data sets of measurements in fractions or decimals, with dot plots or stem‐and‐ leaf plotsNote: These interactive notebook activities were designed to be completed on paper. Howe
Subjects:
Grades:
3rd - 5th
CCSS:
Data Analysis Riddles Dot Plots, Stem/Leaf, Frequency Tables Print & Digital
Do your students need a fun way to practice analyzing data? This is a set of 8 self-checking worksheets for independent practice of Data Analysis. All pages have a fun riddle that is answered by analyzing the data correctly! Kids love to race to find the answers to the riddles!! Don't want to print? Students may now complete this assignment as an EASEL activity!**Here's What's included:Page 1 & 2 – Bar Graphs Page 3 & 4 – Frequency TablesPage 5 & 6 – Dot PlotsPage 7 & 8 – Stem
Subjects:
Grades:
4th - 5th
Types:
CCSS:

Interpreting Graphs for the Middle & Junior High School: Book 2
Here is another set of data graphics for your students to analyze and interpret. Using survey results from the USA Today newspaper, students will be asked to explain what the graphics are illustrating. Each activity will ask the student to identify basic information presented in each graphic and make some projections based on the data given in the survey.
The activities in this packet are a great way to improve your student’s skills in taking apart graphic displays of information. Brin
Subjects:
Grades:
4th - 10th, Adult Education
Types:

Math digital game - basic graphs - 20 self correcting MCQs with worksheet
Test a student's understanding of basic graphs - pie charts, bar graph, straight line graph, bar charts. There are four interactive activities (20 questions) to complete. Each activity will test for understanding and application of the concept. The colorful game is self-correcting, providing feedback after each activity. All activities must be completed to win the game. Students succeed and track their progress as they complete each activity on the supplied worksheet. Correct answers are reward
Grades:
4th - 5th
Types:
Line Graph Assessment: scale, labels, interpreting, continuous vs. discrete data
This activity uses data from a realistic scenario (a bike ride) to assess students’ graphing and interpreting skills when working with line graphs.Assesses if students can:- determine a reasonable scale- create and properly label a line graph- explain how data was collected- differentiate between discrete and continuous data- interpret a line graph- draw reasonable conclusions from a set of data- identify information between data pointsAn answer key included for easy marking out 20 points!This p
Subjects:
Grades:
4th - 8th
Types:
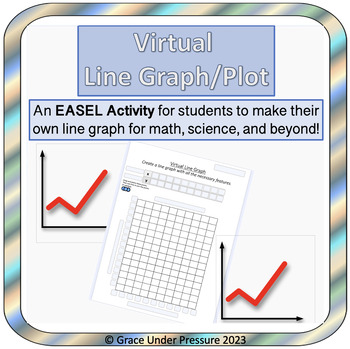
Virtual Line Graph or Scatter Plot Template: EASEL ONLY
This product is a virtual (EASEL) line graph or scatter plot template that can be used for graphing data from math, science, social studies, psychology, or other subjects.You can type in the ordered pairs ahead of time, or you can have your students type them into the (x,y) chart. Then, they have to use the ordered pairs to make a line graph or scatter plot:• Type in a title• Label x & y axis• Choose an appropriate scale and enter it on each axis• Drag and drop the circles as data points• Us
Subjects:
Grades:
Not Grade Specific
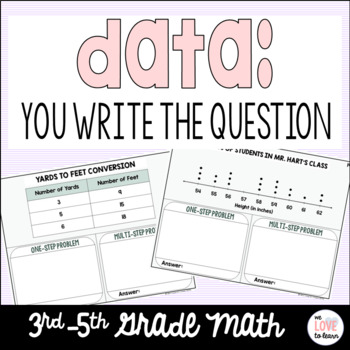
Digital Data Activity: You Write the Question for Google Slides
Looking for a fun, new way for students to interact and better understand data? By having the students write the question, this no-prep, digital activity will challenge students to not just look at the graph to answer the question in front of them, but will encourage them slow down and spend time analyzing the graph to be able to write a one-step and two-step problem. What's Included:Two formats included - PDF and Google Slides30 graphs for students to write word problemsColor Set and Black and
Grades:
3rd - 5th
Types:
Also included in: BUNDLE: 4 Year-Long Math Station Activities
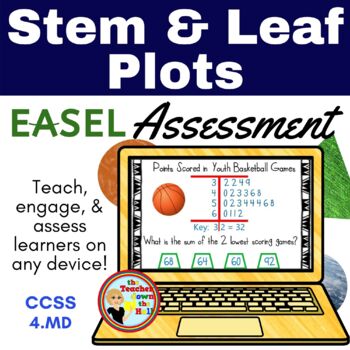
Stem and Leaf Plots Easel Assessment
Need a quick & easy way to assess your students understanding of stem and leaf plots? Students will analyze the data represented to answer questions with addition and subtraction. Send this 20 question Easel Assessment to your students directly from Teachers Pay Teachers. Perfect for distance learning, math centers, and even formative assessments!BENEFITS OF THIS RESOURCE:➡No Prep➡Works on any device➡Self-grading➡Great for Distance Learning➡Immediate Feedback➡Detailed DATA!****************
Subjects:
Grades:
4th - 6th
Types:
CCSS:
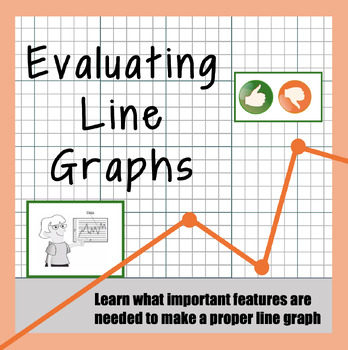
Evaluating Line Graphs Worksheet/Activity (DIGITAL)
Through this activity, students will examine and evaluate six line graphs. Their job is to "grade" each graph and decide what the graph maker has done well and what needs to be improved. During this process, students will be able to discover the seven essential features that need to be included in every great line graph. This is an excellent lesson for before students create their own line graphs for the first time. This package includes:- Teacher instructions- Student handout/worksheet- Answer
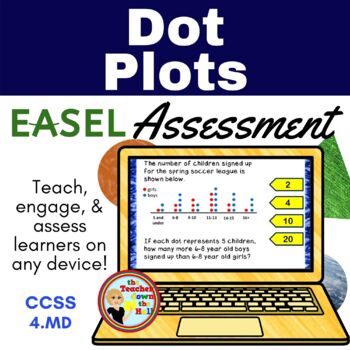
Dot Plots Easel Assessment - Digital Data Analysis Activity
Need a quick & easy way to assess your students understanding of dot plots? Students will analyze the information represented by dot plots to answer math problems involving addition, subtraction, and multiplication. Send this 20 question Easel Assessment to your students directly from Teachers Pay Teachers. Perfect for distance learning, math centers, and even formative assessments!BENEFITS OF THIS RESOURCE:➡No Prep➡Works on any device➡Self-grading➡Great for Distance Learning➡Immediate Fe
Subjects:
Grades:
3rd - 5th
Types:
CCSS:
Showing 1-21 of 21 results


