LINE PLOT Practice Activities with Fractions & Data Task Cards Worksheets
- PDF
- Easel Activity
What educators are saying
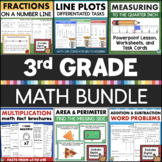
Also included in
- This is a GIANT bundle containing a huge selection of resources aligned to 3rd grade standards! There are 100 full-length math and ELA products including centers, games, assessments, worksheets and more.These were all classroom tested with my own third grade students. You will love how much time andPrice $205.00Original Price $309.85Save $104.85
- This GIANT math bundle for 3rd grade includes games, centers, worksheets, assessments, and more for the whole year! Contains 50 individual, full-length resources totaling 1000+ pages! Many of these resources also included digital versions in Easel.This bundle covers a wide variety of grade 3 math skPrice $105.00Original Price $157.65Save $52.65
Description
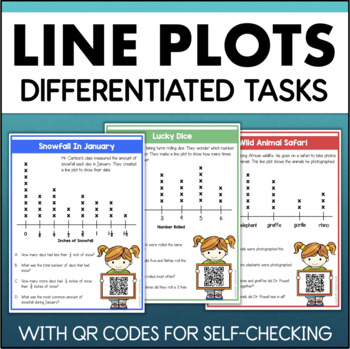
This math resource provides a scaffolded introduction to using line plots for organizing and interpreting data. The activities move from simple categorial data to more complex line plots with fractions.
Each full-page card includes a data set presented in a line plot, along with 4 questions for students to answer. These questions require students to interpret and compare the data.
FEATURES OF THIS RESOURCE:
- differentiated
- ability to self-check
- digital version
INCLUDES:
There are 15 line plot cards divided into three sets of increasing difficulty:
- Set 1: Categorical Data
- Set 2: Numerical Data: Whole Numbers
- Set 3: Numerical Data: Fractions
These activities increase in complexity to build skills as students work through them. The first two sets of cards can be used to teach students how to use line plots even before they have learned fractions. This differentiation allows you to use this resource across grade levels and adapt it to students' differing abilities.
Each card contains a QR code for self-checking. Recording sheets and answer keys are also included as an alternate to the QR codes.
Check out the PREVIEW to see what's included!
DIGITAL ACTIVITIES
All of the tasks have been prepared for use in Easel with answer boxes already inserted. You can assign them through any online learning platform. For more information on Easel Activities see this GETTING STARTED GUIDE.
✅ Don't forget to follow me to be notified about my weekly deals and when new products are added!


