4th Grade Data Analysis, Dot Plots, Stem and Leaf Plots - Online STAAR Review
- PDF
- Google Apps™
- Easel Assessment

What educators are saying
Also included in
- Everything you need for a TEKS centered 4th grade data and graphing unit! Your students will enjoy practicing data analysis, multistep word problems, stem and leaf plots, dot plots, and frequency tables. All of the worksheets, printables, games, and task cards are designed with STAAR testing in mindPrice $15.00Original Price $29.50Save $14.50
- Everything you need to teach 4th grade math TEKS for the ENTIRE SCHOOL YEAR! This bundle includes the TEKS based Math Units 4th grade Texas teachers have been raving about! This year-long bundle gives you ALL the resources you will need to teach the 4th grade math TEKS easily, and without the stressPrice $189.25Original Price $378.50Save $189.25
- This is a great digital 4th grade STAAR review resource to add to your teacher toolbox! Your students will love these fun and engaging digital math task cards to review all the 4th grade math TEKS. There are 8 sets in all, making these math activities easy to use throughout the year, or as an end ofPrice $18.00Original Price $32.00Save $14.00
Description
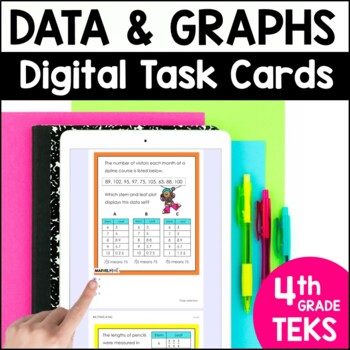
Save time with these fun and engaging Digital Task Cards for Dot Plots, Stem and Leaf Plots and Frequency Tables. These Dot Plot activities and Stem and Leaf Plot graph tasks are perfect for math centers, morning work or online STAAR review. This is a No Prep resource, to save you time!
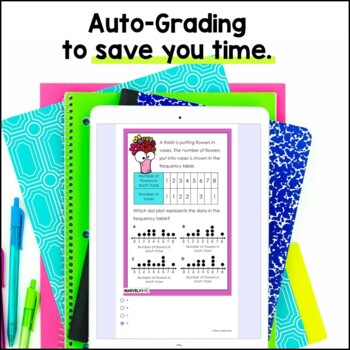
This resource includes 24 TEKS-aligned Digital Task Cards for Data Analysis and Graphs that can be assigned for Math Station Work, Homework, or online STAAR Review. This resource is included in 2 forms: a Google Form and an Easel Assessment. Google Forms can be assigned in Google Classroom or any platform compatible with Google Forms. Easel Assessments can be assigned directly through TpT! Both versions give students instant feedback and are self-grading!
Save Money on this Resource by Purchasing it in a Bundle
Save 40% on individual sets by purchasing the 4th Grade bundle of Self-Grading Task cards.
Save 50% on this set by purchasing the 4th Grade TEKS Data and Graphs Bundle.
Save even more on this set when you purchase the 4th Grade TEKS Year-Long Bundle!
Click HERE to see the printable version of this product.
What's Included?
- 24 Digital Task Cards with STAAR formatted questions
- Printable Teacher Tracking Sheet to record names of students who are struggling with each of the TEKS (based on the problem numbers they missed)
- PDF with a Link to make a copy of the Google Form version in your Google Drive
- Easel Assessment version that can be assigned directly through TpT to students
This set includes Task Cards to help students practice all of the Data & Graphs TEKS.
Topics include:
- Dot Plots with fractions and whole numbers
- Stem-and-Leaf Plots with whole numbers, decimals and fractions
- Frequency Tables
- Single and Multi Step Word Problems using Data from Graphs
Please note that the questions are NOT editable.
I have designed these task cards to give more weight to the Readiness Standards which comprise nearly 2/3 of the STAAR test. The questions are rigorous and have bright graphics to keep students engaged.
TEKS Alignment:
Readiness Standard
4.9A: Represent data on a frequency table, dot plot, or stem-and-leaf plot marked with whole numbers and fractions.
Supporting Standards
4.9B: Solve one- and two-step problems using data in whole number, decimal, and fraction form in a frequency table, dot plot, or stem-and-leaf plot.


