54 results
Graphing Common Core 7.SP.B.3 resources
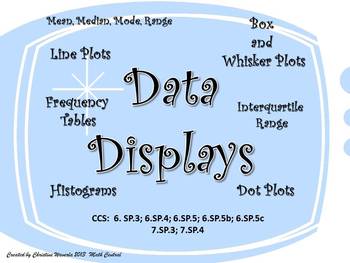
Data Displays: Line Plots, Histograms, Box and Whisker Plots, Frequency Tables
This is one of my favorite teaching tools! I created this Data Display set of worksheets this year for my 6th grade class. My students loved using these worksheets to practice their new skills. Each worksheet provides plenty of room for students to create their data displays and answer questions based on the data. Questions ask students to find the mean, median, mode, range, interquartile range, and percentages.These worksheets are fully aligned with the Common Core Curriculum.CCS: 6.SP.3; 6.SP
Subjects:
Grades:
6th - 8th
Types:
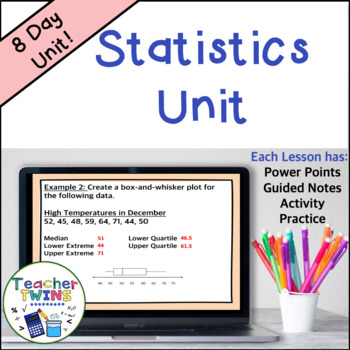
Statistics Unit - Mean Absolute Deviation - Populations and Samples - Box Plots
Make lesson planning easy with this no-prep Statistics - Mean Absolute Deviation - Populations and Samples - Box-and-Whisker Plots Unit! Included are 8 ready-made lessons to teach finding mean absolute deviation as well as interpreting and creating box-and-whisker plots. This unit is very easy to use and will save you a lot of time! Your students will learn how to find mean absolute deviation and interpret box-and-whisker plots by using our editable PowerPoints with guided notes. Students will l
Subjects:
Grades:
6th - 8th
Also included in: 7th Grade Math Curriculum Bundle
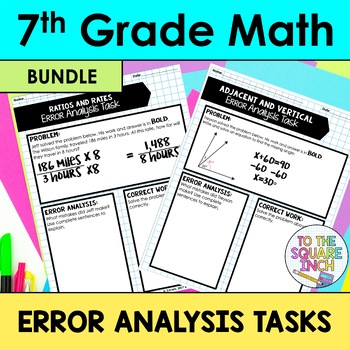
7th Grade Math Error Analysis Task Bundle
7th Grade Math Error Analysis Tasks- One task for each Common Core Standard*60 different error analysis tasks for each 7th Grade Common Core Standard. This is a bundle of 5 different products at over a 20% discount. Please click on each link to see individual product descriptions. The Number System Topics include: Terminating and Repeating DecimalsAdding Integers with Different SignsAdding Integers with the Same SignAdding Rational NumbersMultiplying IntegersDividing IntegersMultiplying Rational
Subjects:
Grades:
6th - 8th
7th Grade Math Curriculum Bundle CCSS Aligned
Looking to integrate technology into your 7th grade math curriculum? This common core aligned product engages your seventh grade students through interactive Google slides. You can assign this to your students digitally or print the slides and distribute them to you students in your classroom. This bundle includes: The number system, integers and rational numbers, percents, ratios, proportions, similar figures, expressions, equations, inequalities, graphing functions, slope, constant of proport
Subjects:
Grades:
7th - 8th
Types:
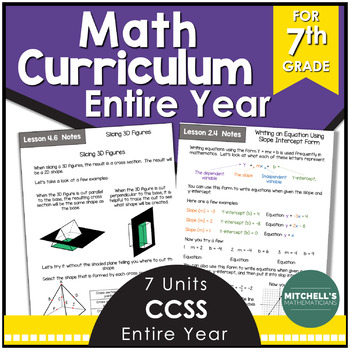
7th Grade Math Curriculum Common Core Aligned BUNDLE
Looking for a NO PREP 7th grade math curriculum that is engaging and rigorous? This common core aligned product is perfect for your seventh grade students. This bundle includes: The number system, integers and rational numbers, percents, ratios, proportions, similar figures, expressions, equations, inequalities, graphing functions, slope, constant of proportionality, geometry, statistics and probability. It is all you will need and more to have an amazing 7th grade year. Just print and go.Unit
Subjects:
Grades:
6th - 8th
Types:

Statistics Survey Project - Project Based Learning (PBL) with Math
Watch your students dive into the world of math as they create, execute, and analyze their own survey! Students will demonstrate mastery of data gathering, survey sampling, developing appropriate survey questions, data tables, Direct Variation, discrete graphs, dot plots, box and whisker graphs, and calculating the inter-quartile range.The Unique Survey Project is highly engaging, capitalizing on the innate curiosity of the adolescent mind. You will love the low-prep instructional guide. Your st
Subjects:
Grades:
6th - 10th
Types:
Also included in: Fun with Ratios Activities Bundle - 7th Grade PBL with Math
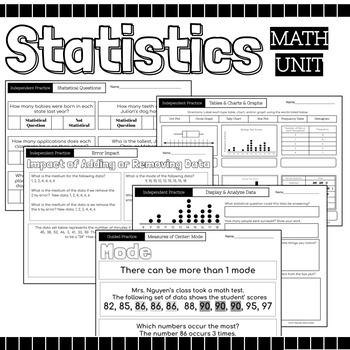
Statistics Math Packet {Data, Charts, Graphs, Mean, Median, Mode, Range, Spread}
52 Page Statics Unit Includes: Guided Instruction & Independent Practice Pages Usage Suggestions and IdeasThis resource can be utilized in numerous ways, here are some ideas:use for guided practiceassign as partner workassign as independent practicecan be used for morning workuse for reteaching in small group settinguse as review prior to assessmentuse as review in continuing to strengthen skillassign for homeworkuse as independent work during math centersTopicsRecognize Statistical Question
Subjects:
Grades:
4th - 12th
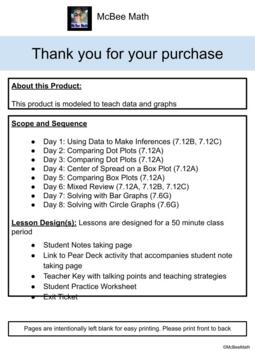
7th Grade Math Data and Graphs Lesson Plans 7.12A, 7.12B, 7.12C, 7.6G
This product is designed to teach 7th grade math data and graphs TEKS.7.6(G) solve problems using data represented in bar graphs, dot plots, and circle graphs, including part‐to‐whole and part‐to‐part comparisons and equivalents (10 out of 5)7.12(A) compare two groups of numeric data using comparative dot plots or box plots by comparing their shapes, centers, and spreads (10 out of 5)7.12(B) use data from a random sample to make inferences about a population (2 out of 5)7.12(C) compare two popul
Subjects:
Grades:
7th
Types:
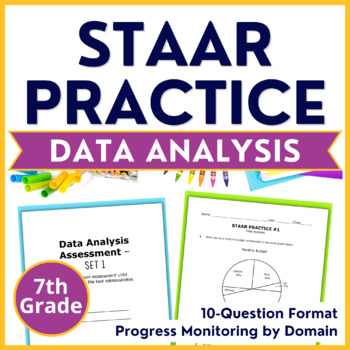
7th Grade Math STAAR Practice Data Analysis - Progress Monitoring by Domain
Make sure your students are mastering the grade-level standards at a rigorous high-stakes testing level. These TEKS & STAAR Aligned 10 Question Assessments are easy to incorporate as quick checks, review, practice, progress monitoring, guided math, intervention, and test prep! These STAAR Practice assessments are grouped by related standards/topics allowing for targeted practice. The 10-question format makes test prep, review, and practice much more manageable!⭐ This resource is now availabl
Subjects:
Grades:
7th
Types:
Also included in: 7th Grade Math STAAR Practice Bundle - Progress Monitoring by Domain
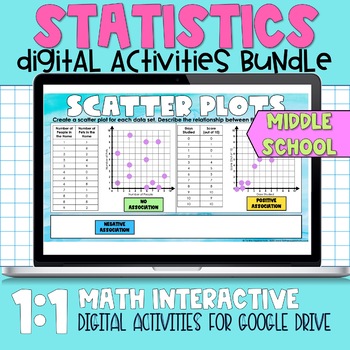
Statistics Digital Activities
Middle School Math Statistics Digital Activities for Google Drive for Distance Learning Activities Included:1. Histograms2. Statistical Questions 3. Scatter Plots4. Stem and Leaf Plots5. Line Plots6. Measures of Central tendency 7. Box and Whisker Plot
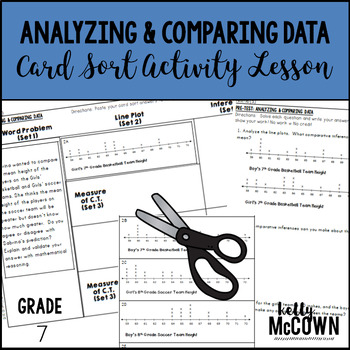
Analyzing and Comparing Statistical Data Card Sort Activity Lesson
This lesson unit is intended to help you assess how well students are able to informally assess the degree of visual overlap of two numerical data distributions with similar variabilities, measuring the difference between the centers by expressing it as a multiple of a measure of variability. Students also use measures of center and measures of variability for numerical data from random samples to draw informal comparative inferences about two populations.
Included in this lesson are:
-One for
Subjects:
Grades:
7th
Types:
Also included in: Math Card Sort Activity Grade 7 BUNDLE
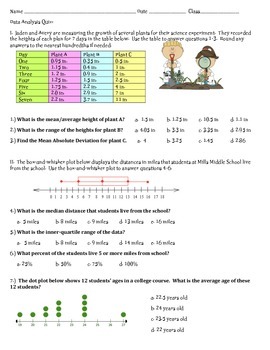
Statistics Quiz 7th Grade Math~ Measures of Center and Variance
11 question multiple choice quiz that assesses students' understanding of measures of center (mean and median) and measures of variance (range and mean absolute deviation. Students will analyze box-and-whisker plots, dot plots and tables.
Answers Included
Grades:
6th - 7th
Types:
Graphs and Data Interactive Notebook Lessons {6.SP and 7.SP}
Looking for step by step instructions for interactive notebooking using data and graphs? This file is exactly what you need! There are complete instructions for notebook organization and how students use a self assessment stop light graphic organizer to communicate their comprehension of the lesson. For each lesson, there are complete instructions, student foldables to make the entries completely interactive, and pictures of sample pages. Each lesson also contains data to use with the foldables.
Subjects:
Grades:
4th - 7th

Fun with Ratios Activities Bundle - 7th Grade PBL with Math
The purpose of the Fun with Ratios Activities Bundle is to give students the opportunity to use creativity to apply ratios, proportions, and percentages in real-world settings. This bundle includes three unique tasks: Black Friday Mastery Task, Direct Variation Poster Mastery Task, and the Unique Survey Project. These activities and their accompanying materials are suited for students in grades 7 through 9. These lessons make excellent sub plans. Each project takes approximately two 60-minute bl
Subjects:
Grades:
7th - 9th
Types:
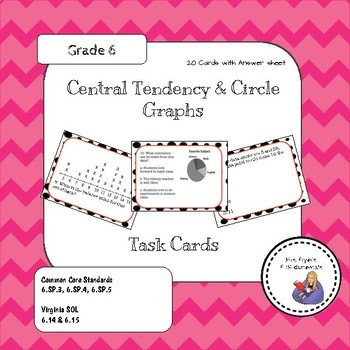
Central Tendency Task Cards with Circle Graphs
Task cards are highly motivating and an effective teaching tool that can be used across the curriculum. I use them individually, in pairs, with small groups, or as an activity for the whole class. My favorite way to use them is in the game “scoot”. I tape the cards on the desks (or walls) and play musical chairs. When the music stops, the students have to sit at a new seat with a different card, or just move in a circle. Students use the answer sheet provided to answer. (Another version of this
Subjects:
Grades:
6th
Types:
Statistics & Probability Activities | 7th Grade Word Problems | 7.SP.1 - 7.SP.8
Are you looking for a unit's worth of engaging printable & digital activities that cover the 7.SP Common Core Domain (Statistics & Probability) while being immediately implementable in printable and digital formats? If that sounds like something you might be interested in, I'm confident this product is going to meet and exceed your expectations!If accessed digitally, these task card sets can be pre-loaded as no-prep assessments/assignments through Google Forms™, Google Slides™, or as a B
Subjects:
Grades:
7th - 8th
Types:
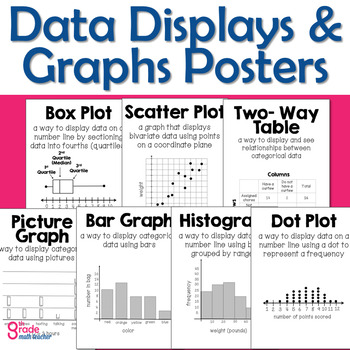
Types of Graphs and Data Displays Posters
Need visuals for your statistics unit? These 7 printable posters show definitions and examples for students of vocabulary they can reference as they learn. They are simple, easy to read, and informative. It's math classroom décor with an important purpose!Hang these posters as part of your word wall all year or when you teach your statistics unit. They are the perfect visual aids and have information students need.Make them colorful! The posters are black and white and can be printed on any colo
Subjects:
Grades:
3rd - 8th
Types:
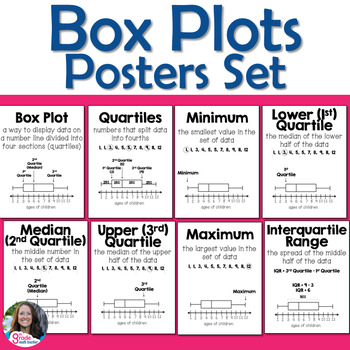
Box Plots Posters Set for Word Wall or Bulletin Board
Need visuals and reminders for your box plot lessons? These 8 printable posters show definitions and examples for students of vocabulary they can reference as they learn. They are simple, easy to read, and informative. It's math classroom décor with an important purpose!Hang these posters as part of your word wall all year or when you teach your statistics unit. They are the perfect visual aids and have all the important information students need to learn box plots.Make them colorful! The poster
Subjects:
Grades:
6th - 7th
Types:
Comparing Data Distributions | Mean Absolute Deviation Activity for 7.SP.3
Are you looking for a fun and flexible differentiated* activity that provides a rich variety of practice problems for Common Core Standard 7.SP.3 (Comparing Data Distributions With Visual Overlap | Mean Absolute Deviation). We've set up this these common core-aligned digital and printable task cards so that they can be seamlessly integrated into your lesson plan whether you are teaching in class or remotely. (with little to no prep work). ============================These graphing equations and
Subjects:
Grades:
7th - 8th
Types:
CCSS:
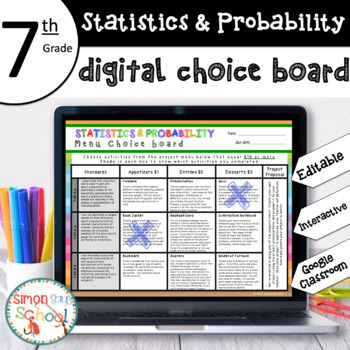
7th Grade DIGITAL Statistics & Probability Choice Board - Distance Learning
7th Grade DIGITAL Statistics and Probability Enrichment Choice Board – EDITABLE – NO PREP This editable DIGITAL choice board for Google Drive™ is an amazing differentiation tool for distance learning that not only empowers students through choice but also meets their individual needs. You will find that the fractions enrichment board contains three leveled activities for each standard: appetizer, entrée, and dessert from my printable resource: 7th Grade Statistics and Probability Enrichment Cho
Subjects:
Grades:
7th
Types:
Also included in: 7th Grade DIGITAL Math Choice Board Bundle for Distance Learning
6th-9th Grade Gummy Bear Math Activity- Data and Statistics
This is a fun (and yummy) Math activity created to review data and statistics concepts from 6th grade. Fun test practice/review! It can also be used as review or instruction for 7th-9th grades.You WILL need to buy gummy bears! Students will sort and count, then compare their bears with others.This is printable. But, included in the download is an editable Google Doc. Also, I have included a grading rubric and vocabulary sheet that can be printed for student binders/notebooks.Concepts covered:Me
Subjects:
Grades:
6th - 9th
Types:
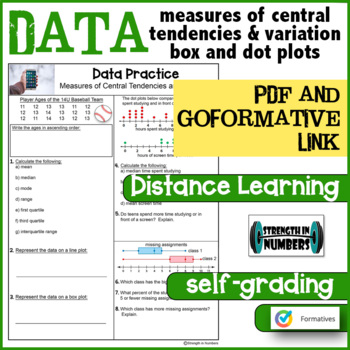
DATA: Measures of Central Tendencies Dot/Box Plot Distance Learning GOFORMATIVE
This product covers data - measures of central tendencies and variation (mean, median, mode, range, first/lower quartile, third/upper quartile, interquartile range, making and evaluating two sets of data in box and dot plots. It includes a PDF practice page in color. Simply use the pdf as a traditional worksheet or use the provided link to make the worksheet a digital, self-checking assignment. The same questions are on a goformative.com assignment that is set up to automatically grade your st
Subjects:
Grades:
6th - 10th
Types:
Also included in: 7th Grade Math 7 Complete Year of PDF goformative.com BUNDLE
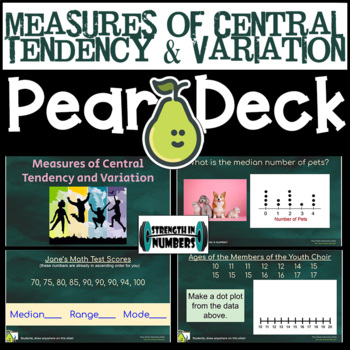
Measures of Central Tendency/Variation Digital Activity Google Slides/Pear Deck
This product includes a digital Google Slides presentation with a PearDeck add-on. Works great with in-person or distance learning. Watch students work in real time and share answers with the class without showing names. The slides can be used alone for a class presentation but are meant to be used with the Pear Deck add-on. Simply open the slides, make a copy, go to Add-ons → Pear Deck and then click the green “start lesson” button on the right hand side where the Pear Deck options pop up.
Subjects:
Grades:
6th - 9th
Also included in: 7th Grade Math 7 Complete Year BUNDLE 41 Google Slides/Pear Deck
Find the Error - Data and Graphs with Central Tendency and Variation
This is an activity that I created for my students to find the mistake when a student has answered questions from graphs about measures of center and variation incorrectly. I used common errors to help them see the mistakes commonly made. All of my products are common core aligned.I had the students work alone to solve the problems first, and then share with their groups. If there was any discrepancy, they looked in the answer folder on their tables to see the correct answer. I rotated around
Subjects:
Grades:
5th - 7th
Showing 1-24 of 54 results


