TPT
Total:
$0.00
Selected
Subjects
19 results

Science Common Core 7.SP.B.3 resources
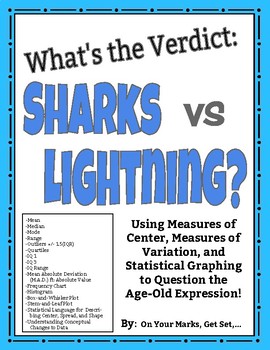
Preview of What's the Verdict: Sharks vs. Lightning? Modes of Center, Spread, and More!

What's the Verdict: Sharks vs. Lightning? Modes of Center, Spread, and More!

Put it to the test! Use the age-old expression: "You are more likely to get struck by lightning than to be bitten by a shark!" to learn and practice Measures of Center, Measures of Spread, Measures of Shape, and Statistical Graphing including:MEANMEDIANMODERANGEOUTLIERS [Using IQR +/- 1.5(IQR)]QUARTILES [lower quartile (IQ-1) and upper quartile (IQ-3)]INTERQUARTILE RANGE (IQR)MEAN ABSOLUTE DEVIATION/ M.A.D. ft. ABSOLUTE VALUESYMMETRY/ASYMMETRY OF DISTRIBUTIONCLUSTERS AND GAPSBELL SHAPED CURVE AN
Preview of Amplify: Natural Selection Histograms/ Adaptive/Non Adaptive Traits Practice
Amplify: Natural Selection Histograms/ Adaptive/Non Adaptive Traits Practice

Created by
Michael Thomas
This worksheet uses a short reading of a few paragraphs as well as a table of data about coyotes in the Western United States to help students interpret data through the creation of histograms.This is a good "show what you know" about adaptive and non adaptive traits as well. They will answer questions about the data, write a claim, and support it with evidence. I use this worksheet for practice (and something to grade!) for Amplify Natural Selection, but it could easily be used in math as wel
Preview of Box and Whiskers Plot Weather Project
Box and Whiskers Plot Weather Project

Created by
The Math Shack
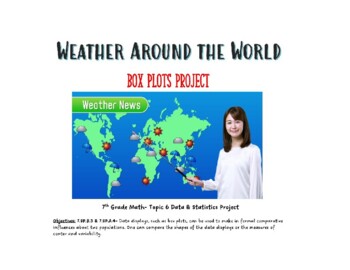
This is an engaging Data and Statistics Project that integrates math and science. Students will have an opportunity to showcase their knowledge about what they have learned from the Data and Statistics Topic and more specifically Box and Whisker Plots. This project requires students to record the weather in cities around the world and the U.S. using weather.com, give the weather forecast for a specific world and U.S. city, create Box and Whisker Plots with 5-Number Summaries, and make an iMovie
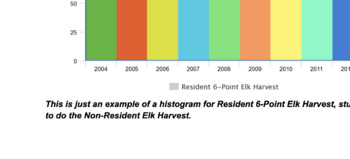
Preview of Amplify Science/Math Natural Selection: Elk Histograms and Data Interpretation
Amplify Science/Math Natural Selection: Elk Histograms and Data Interpretation

Created by
Michael Thomas
This worksheet will work well for students who are part-way through the Natural Selection Unit of Amplify, or students who need some practice interpreting data and representing it in histograms or bar graphs. This would also work well for a day where you had a sub. Students will be asked to find answers to questions by looking at data as well as determine if there are any patterns in the data. They will also realize that different forms of data representation lends itself to finding patterns mo
Preview of Pandemic Cross-Curricular Project (Coronavirus Distance Learning)
Pandemic Cross-Curricular Project (Coronavirus Distance Learning)

Items included in this resource (PDF and Editable):-Project Title Page-Table of Contents-PBL Letter from the CDC-Generic Overview of Project-Math Assignment (Crossed with Science)-Science Assignment (Crossed with Math, Social Studies, and ELA)-Social Studies Assignment (Cross with Math, Science, and ELA)-ELA (Crossed with Science and Social Studies)-Due Date Table (Rough and Final Drafts)-Help Session Table (Math, Science, Social Studies, ELA)-Rubrics (Math, Science, Social Studies, ELA)-Resourc
Preview of 6 Editable Bar Graph Templates 2.0

6 Editable Bar Graph Templates 2.0

Finally a simple and professional graph space that students can fill out without any design issues getting in the way. This file contains 6 ready-to-use graph options. Print them and have students fill them with pencil and ruler, or distribute them over computer and let them practice entering the data. Get a project perfect finish every time. Maybe you just want to fill it out live on a projector? The possibilities are endless! It's okay to say you love these bar graphs. So do we.Contains:- 2 bl
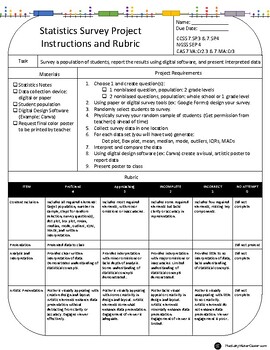
Preview of Statistics Survey Project

Statistics Survey Project

Facilitate school connectedness, visual art and 7th grade statistics with this end of unit survey project. I utilize this project in lieu of a final test. Students generate questions of interest, decide on their target student population and physically collect data. With this data, students design posters using digital art software and publicly present their real life findings.
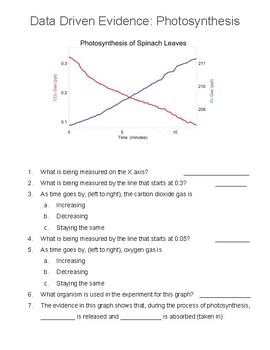
Preview of Data Driven Lesson: Evidence of Photosynthesis

Data Driven Lesson: Evidence of Photosynthesis

Created by
Usable Tomorrow
Use graph data to understand the roles of carbon dioxide, oxygen, and light in photosynthesis (2 sided)
Preview of Teaching with Baseball Statistics

Teaching with Baseball Statistics

Created by
Cecile Greene
I use this activity to teach my science students how to model an idea using data. Students learn to predict the outcomes of a baseball pitcher based on their last 3 years of stats. Students learn to analyze their data and determine trends in the data. Students also learn to compare data from their pitcher to other students' pitchers (collaboration). Students also must be able to/learn to accurately graph their data. There is also a research component as students must research their pitcher's
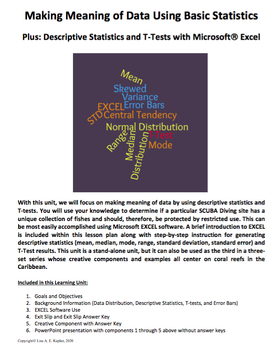
Preview of Making Meaning of Data Using Basic Statistics – Plus Statistics with EXCEL
Making Meaning of Data Using Basic Statistics – Plus Statistics with EXCEL

This learning unit includes two files ­– a PDF document and a PowerPoint presentation. The PDF includes the following components and can be used solely by the teacher or modified to remove the assessment pieces and distributed to the students. 1. Goals and Objectives2. Background Information a. Data Distribution, Descriptive Statistics, T-tests, and Error Barsb. EXCEL Software Use3. Assessmentsa. Exit Slip and Exit Slip Answer Keyb. Creative Component with Answer Key All of the background info
Preview of Statistics Study Reader: Find measures of center (mean, median, mode) and range
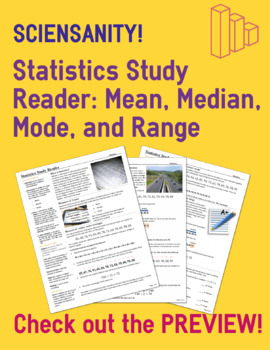
Statistics Study Reader: Find measures of center (mean, median, mode) and range

Created by
Sciensanity
Give your students what they need to succeed! This study reader defines statistics, explains why it's important, and provides instructions on how to perform four types of key statistical analysis: mean, median, and mode (measures of center) and range.It explains the concepts in clear, simple language and provides detailed examples so your students can use it as a reference when learning how to solve statistical problems. Geared toward upper elementary and early middle school, but appropriate for
Preview of Grades 6-8 STEM Packet

Grades 6-8 STEM Packet

Created by
Brandy Williams
These are some of the coolest, 6-8 grade STEM activities! Do you want to test Science and Math without hearing your students raise a fuss? Try this packet. The packet includes questions for reflection, charts and graphs for observation and scientific discovery, and best of all, your Science GLEs for and Standards are aligned and listed!!!
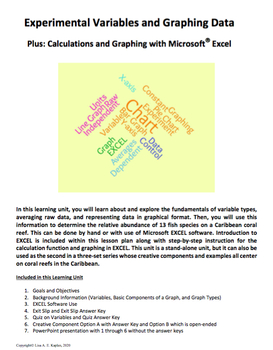
Preview of Experimental Variables and Graphing

Experimental Variables and Graphing

This learning unit includes two files ­– a PDF document and a PowerPoint presentation. The PDF includes the following components and can be used solely by the teacher or modified to remove the assessment pieces and distributed to the students. 1. Goals and Objectives2. Background Information a. Variables, Components of a Graph, Graph Typesb. EXCEL Software Use3. Assessmentsa. Exit Slip and Exit Slip Answer Keyb. Quiz on Variables and Answer keyc. Creative Component Options A with Answer Key and
Preview of Big Ideas Math 7th Grade Fill in Notes- Unit 11 Data Display
Big Ideas Math 7th Grade Fill in Notes- Unit 11 Data Display

This product is designed using the Big Ideas Math Curriculum- Minnesota Edition. These are fill in notes the align with the lessons for the unit. Each lesson is either 2-3 pages. Each new lesson will have the lesson and objectives on the top left corner of the page. I usually print them off double sided and 3 hole punched so students can put them in a three hole binder. You can also print them off as one entire packet for the unit! These notes are perfect for accommodations whether it is for vis
Preview of The Big Bite Mosquito Game (Ready to Print!)
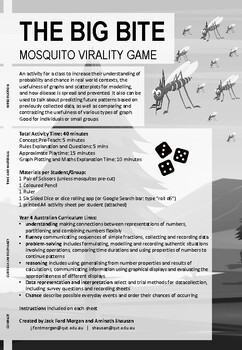
The Big Bite Mosquito Game (Ready to Print!)

Created by
Curriculum Games
An activity for a class to increase their understanding of probability and chance in real world contexts, the usefulness of graphs and scatterplots for modelling, and how disease is spread and prevented. It also can be used to talk about predicting future patterns based on previously collected data, as well as comparing and contrasting the usefulness of various types of graph. Features an important topic, related to health, prevention, and using science to aid populations. Good for individuals o
Preview of Science & Math | Rising Temperature Lesson | Graphing | Free
Science & Math | Rising Temperature Lesson | Graphing | Free

Created by
SubjectToClimate
In this lesson, students choose temperature data to graph in order to explore the relationship between maximum and minimum New Jersey temperatures over time.Step 1 - Inquire: Students interact with two data tables showing maximum and minimum average temperatures in New Jersey.Step 2 - Investigate: Students choose data to graph both max and min temperatures over time and discuss their findings.Step 3 - Inspire: Students watch a video showing the current effects of temperature in New Jersey and ex
Preview of Scientific Method Mini Trifold Board Template
Scientific Method Mini Trifold Board Template

Created by
Caryn Dingman
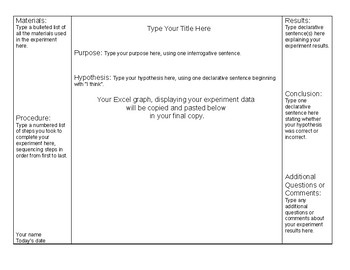
Students can create mini trifold boards, to display any science experiment using the Scientific Method format with this Word document template. Teachers can save and share this with their students using public file storage available on school servers, Google Drive, etc. This classroom-tested template was used for a Valentine Candy Heart Investigation project I developed. Student sample work may be viewed on my classroom web site here: http://www.mrsdingman.com/Vday_Mini_Tri-Fold_Julia.pdf htt
Preview of Analyzing Data Nearpod (Lesson Plan Included)
Analyzing Data Nearpod (Lesson Plan Included)

Created by
JackMcHair
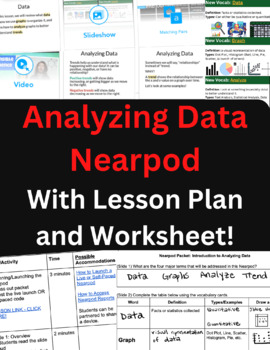
This Nearpod* activity is an introduction to analyzing data that works to either introduce the topic or review the key points. It starts by reviewing the two kinds of data (qualitative and quantitative) and common graphs (Line, Bar/Histogram, Dot Plots). Then it explores how to read a graph to see trends (positive/negative/no relationship) and gives students opportunities to practice reading graphs to identify whether there is a trend.What's Included:In addition to the Nearpod (9 slides), this d
Preview of Middle School — Lesson 1: Water Resources and Water Footprints

Middle School — Lesson 1: Water Resources and Water Footprints

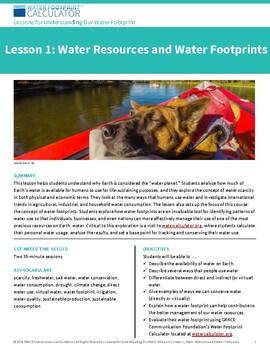
This lesson gives students an in-depth understanding of key water issues. They learn about water resources and water footprints, then use the Water Footprint Calculator to analyze their direct and virtual water consumption. Students get a foundation of knowledge and learn why they should care about protecting water resources, which makes it easier for them to make a fundamental shift in attitude about their water use. Designed for middle school – lower secondary level, ages 11 to 14 – the lesson
Showing 1-19 of 19 results

Find Science resources | TPT

Importance of learning science

Learning science is particularly important for students as it equips them with the essential knowledge and skills to make sense of the world around them. Science education is not just about memorizing facts. It fosters critical thinking, inquiry, and problem-solving abilities. These skills are not only useful in school but also in everyday life beyond the classroom.

Benefits of learning science

Learning science offers many benefits to students both in school and beyond. In fact, it helps students:

  • Question the world around them and seek evidence-based explanations
  • Cultivate their ability to observe, experiment, and analyze data
  • Nurture a sense of curiosity, awe, and wonder about the natural world
  • Understand natural phenomena and the laws that govern the universe

With a solid foundation in science, teachers can help empower students to think critically, solve problems, make informed decisions, and engage with the world around them in meaningful ways.

Teaching with science resources

One of the best parts about science class is all of the possibilities for hands-on, collaborative learning! Think: labs, experiments, inquiry-based activities, and design challenges. These activities encourage students to explore scientific concepts by observing, asking questions, and conducting investigations. Additionally, with small group centers, students can engage in group experiments, discussions, and projects that require them to collaborate, share ideas, and solve problems together.

Discover printable and digital science resources

If you’re a teacher or parent looking for printable or digital science resources, TPT has an extensive array of instructional materials for every learning need, topic, or grade level. Whether you're learning about plant parts or butterfly life cycles, or exploring advanced topics like the anatomy of a cell or Newton’s laws of motion, we've got you covered.

On TPT, science resources come in various forms: from labs and worksheets to craftivities and doodle notes. They can be used to enhance learning, assess a student’s mastery of science concepts, or to reteach a tricky topic. With plenty of TPT resources at your fingertips, teaching and learning science will be so much easier. Plus, you can expand students’ knowledge even further by exploring TPT math resources, which are frequently paired with science lessons.

Frequently asked questions about teaching science

What types of science lessons are available on TPT?

There are many different types of science resources sold by Sellers on TPT. Some popular science lessons include biology, earth sciences, chemistry, environment, engineering, and anatomy.

How do I find science lessons on TPT?

Educators can save time preparing science lessons with resources created by experienced teachers. Simply start a search for science resources on the TPT marketplace, and filter by grade level, price, and/or resource type to find materials that've been proven to work in classrooms like yours. No matter what you’re teaching, there are plenty of science lessons and activities sold by Sellers on TPT that are tailored to meet your students' skill levels.

How can I make my science lessons fun and engaging?

Students learn best when they're engaged! Sprinkle a little fun into your science lessons and make them feel like real scientists by investigating everyday objects, exploring the world outside the classroom, and doing hands-on and collaborative experiments and design challenges.