3 results
Environment Common Core 7.SP.B.3 resources
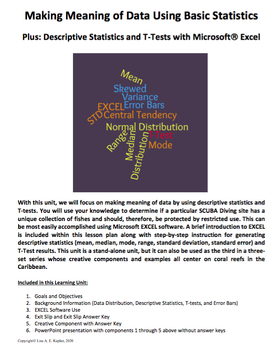
Making Meaning of Data Using Basic Statistics – Plus Statistics with EXCEL
This learning unit includes two files – a PDF document and a PowerPoint presentation. The PDF includes the following components and can be used solely by the teacher or modified to remove the assessment pieces and distributed to the students. 1. Goals and Objectives2. Background Information a. Data Distribution, Descriptive Statistics, T-tests, and Error Barsb. EXCEL Software Use3. Assessmentsa. Exit Slip and Exit Slip Answer Keyb. Creative Component with Answer Key All of the background info
Subjects:
Grades:
7th - 10th
CCSS:
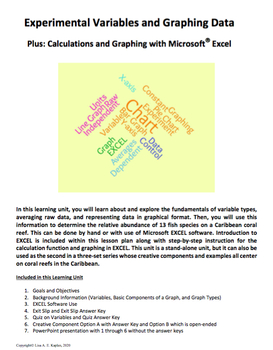
Experimental Variables and Graphing
This learning unit includes two files – a PDF document and a PowerPoint presentation. The PDF includes the following components and can be used solely by the teacher or modified to remove the assessment pieces and distributed to the students. 1. Goals and Objectives2. Background Information a. Variables, Components of a Graph, Graph Typesb. EXCEL Software Use3. Assessmentsa. Exit Slip and Exit Slip Answer Keyb. Quiz on Variables and Answer keyc. Creative Component Options A with Answer Key and
Subjects:
Grades:
7th - 9th
CCSS:
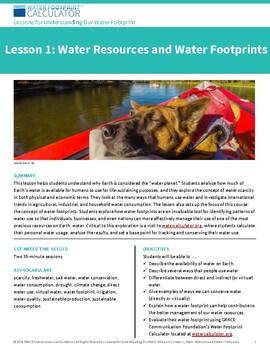
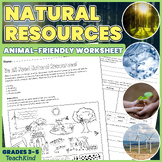
Middle School — Lesson 1: Water Resources and Water Footprints
This lesson gives students an in-depth understanding of key water issues. They learn about water resources and water footprints, then use the Water Footprint Calculator to analyze their direct and virtual water consumption. Students get a foundation of knowledge and learn why they should care about protecting water resources, which makes it easier for them to make a fundamental shift in attitude about their water use. Designed for middle school – lower secondary level, ages 11 to 14 – the lesson
Subjects:
Grades:
5th - 8th
Types:
NGSS:
MS-ESS2-3
, MS-ESS2-2
, MS-ESS3-5
, MS-ESS3-4
, MS-ESS2-4
...
Showing 1-3 of 3 results


