TPT
Total:
$0.00
Selected
Subjects
Prices

Subjects

Arts & Music
English Language Arts
Holidays/Seasonal
Math
Science
Social Studies - History
Specialty
For All Subject Areas
46 results

Math Common Core RST.6-8.1 resources under $5
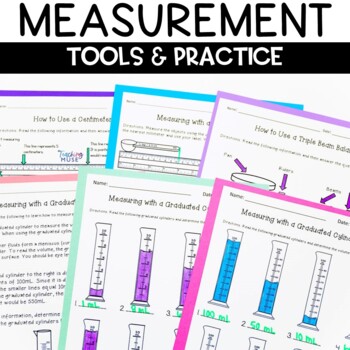
Preview of Metric Measurement Activities Science or Math Test Prep Activity
Metric Measurement Activities Science or Math Test Prep Activity

Created by
Teaching Muse
Introduce metric measurement to your students using worksheets or Google Slides that will detail how to use the triple beam balance, graduated cylinder, and centimeter ruler to determine an object's mass, volume, and length. Students will have a deeper understanding of measuring and manipulating the science and math tools. Students can interpret readings in grams, liters, and centimeters. This teaching lesson would also be great for reviewing important math and science concepts for test prep. Li
Preview of Data Analysis and Graphing Worksheet Scientific Method Practice (Herons)
Data Analysis and Graphing Worksheet Scientific Method Practice (Herons)

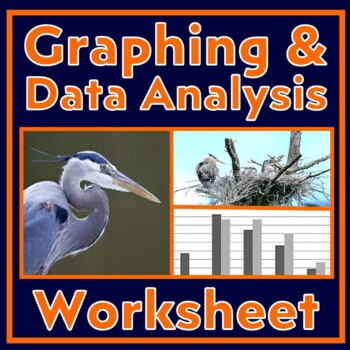
Students build GRAPHING and DATA ANALYSIS skills. This activity provides a data table and an incomplete bar graph related to nesting habits of herons. Students follow directions that lead them through foundational graphing and data analysis skills. Instruction is built into the worksheet. This activity builds the following skills:Setting up bar graphs, including choosing intervals, labeling axes, and writing graph titles.Using data to make a bar graph (with an example already in place).Pulling
Preview of Claim Evidence Reasoning Practice & Reading Forces Motion (CER) Digital
Claim Evidence Reasoning Practice & Reading Forces Motion (CER) Digital

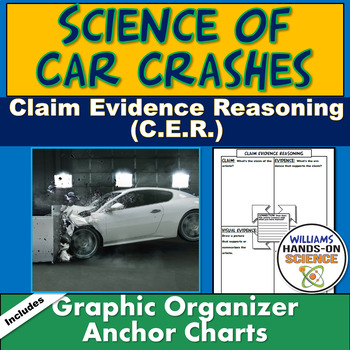
With this product students will learn about some of the science behind car crashes by reading an article from scienceabc.com. The article asks if double a car’s speed double the force of impact. What the article explains using the equation for Kinetic Energy (KE=1/2mass x velocity²), is that impact force actually increases by 4-6 times when velocity doubles! Students will use evidence in the article that the author provides, draw visual evidence and reason why the data supports the author’s cla
Preview of Bell Ringer Graphing in Science

Bell Ringer Graphing in Science

Created by
Teaching Muse
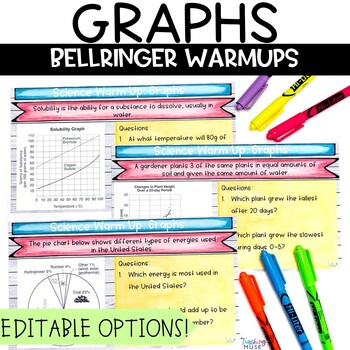
Do your students need practice reading and understanding graphs? Add this bellringer to your science classroom routine this back to school season. The 20 graphs will help students warm up their science skills to analyze, interpret, and demonstrate their understanding of graphing. The graphs include an editable option to allow you to write questions specific to your classroom. This activity includes circle graphs, bar graphs, line graphs, and double line graphs. Students will: Analyze, interpret,
Preview of Graphing and Analyzing Data Activity with Scientific Method (Woodpeckers)
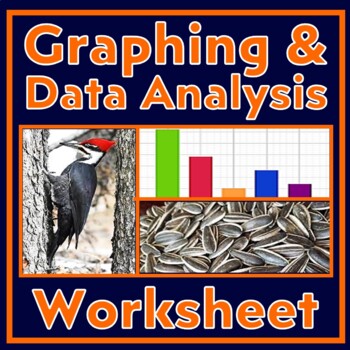
Graphing and Analyzing Data Activity with Scientific Method (Woodpeckers)

Use this data analysis and graphing worksheet to build GRAPHING and DATA ANALYSIS skills. This worksheet provides a data table from an experiment designed to find out which food woodpeckers prefer. Students follow directions that lead them through foundational graphing and data analysis skills, including making a bar graph and then analyzing it. Instruction is built into the worksheet. Students will practice the following skills in this activity:Setting up bar graphs, including choosing inter
Preview of Scientific Method Worksheet Graphing and Data Analysis Practice (Falcons)
Scientific Method Worksheet Graphing and Data Analysis Practice (Falcons)

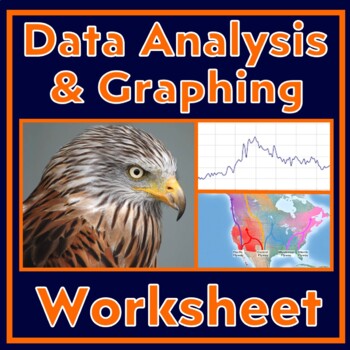
Use this data analysis and graphing worksheet to build GRAPHING and DATA ANALYSIS skills. This worksheet provides a data table about the distances that falcons travel. Students follow directions that lead them through graphing and data analysis skills, including making a line graph and then analyzing it.Instruction is built into the worksheet.Students will practice the following skills in this activity:Setting up line graphs, including choosing intervals, labeling axes, and writing graph titles.
Preview of Scientific Method Worksheet Graphing and Analyzing Data Activity (Hummingbirds)
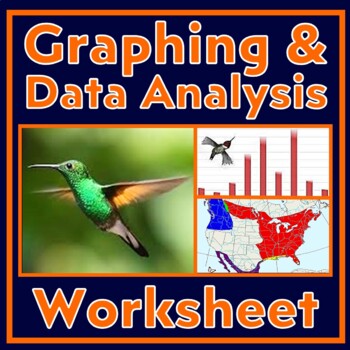
Scientific Method Worksheet Graphing and Analyzing Data Activity (Hummingbirds)

Build GRAPHING and DATA ANALYSIS skills! This worksheet provides a data table related to hummingbird migration. Students follow directions that lead them through graphing the data and analyzing it. Students will practice the following skills in this activity:Setting up bar graphs, including choosing intervals, labeling axes, and writing graph titles.Generating a bar graph from provided data.Pulling data from their graph.Data analysis that requires using data as evidence to support conclusions.R
Preview of Metric System Worksheets Measurement Activities
Metric System Worksheets Measurement Activities

Created by
Teaching Muse
Review the metric measurements for length, mass, and volume using these engaging hands on activities that will have students practicing how to use the triple beam balance, graduated cylinder, and centimeter ruler. The 7 metric measurement stations will reinforce learning of the centimeter ruler, graduated cylinder, and triple beam balance as students measure for mass, length, and volume. Like these metric measurement hands on activities? Check out the bundle and save 20% by clicking here. This m
Preview of Graphing in Science Activity

Graphing in Science Activity

Created by
Teaching Muse
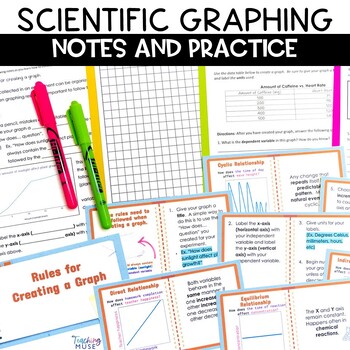
Teach your students to create a graph in science, graph independent and dependent variables, and understand graphing relationships using this print and digital activity. This scientific graphing lesson includes a teacher presentation to introduce graphing rules, how to graph variables, and graphing relationships. Students will follow along on their fill in note sheet and complete the practice problems. In addition, there is a graphing assessment to track student progress. Students will learn: Gr
Preview of A Long Walk to Water Project

A Long Walk to Water Project

Created by
LIT Lessons
The set of resources will engage students to think critically about their water consumption habits. Through investigation, data collection, analysis, and reflection, students will consider the importance of water and how their own water use may affect the environment. It is an active inquiry into the daily habits that they might take for granted but that can have a big impact on the environment. All the activities also develop skills aligned to Common Core State Standards, such as close reading,
Preview of Skittle Radiometric Decay Half-life Lab
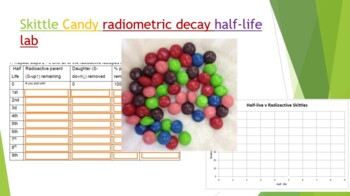
Skittle Radiometric Decay Half-life Lab

Created by
3D-PT
Did you know you can use Skittles candy to demonstrate absolute dating and radiometric decay! Buy a 1-4 lb bag at your local bulk warehouse store for savings. This lab is a great way to show how isotopes decay by shaking a plate full of random skittles. Students use Skittles to observe "Isotopes" decay over each half life. At the end of the lab (and only IF they have done all their work) they can enjoy their "daughter products". Skittles were used because they are durable, hypoallergenic, and th
Preview of Back to School Science Activity

Back to School Science Activity

Created by
Teaching Muse
Use this science skill lesson to introduce or review how to classify, estimate, measure, predict, observe, and infer with your students. Science vocabulary posters, printable worksheets, Google Slides, and a Nearpod presentation are included to help students learn and master basic science skills. Students will learn:Important science terms classifycommunicatepredictmeasureestimateobservation inferenceThis science lesson includes: Digital links to a student Google Slide and Nearpod classroom pres
Preview of Metric Measurement Review Activity

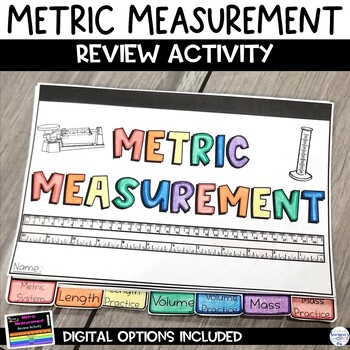
Metric Measurement Review Activity
Created by
Teaching Muse
Review metric measurement with your students using this print and digital distance learning activity to review the metric system, mass, volume, and length. Students will learn the tools (centimeter ruler, Graduated cylinder, triple beam balance), units (gram, liter meter), and how to measure using the metric system. To allow for flexibility in the classroom, a printable and Google Slide version of the review activity are included. Like this activity? Check out the metric measurement bundle and s
Preview of Converting Metric Units with Metric Conversion Activities
Converting Metric Units with Metric Conversion Activities

Created by
Teaching Muse
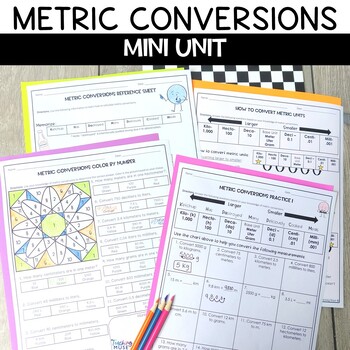
Introduce metric conversions to your students using this unit! Students will learn how to convert metric measurements by following the step by step instructions, learn a mnemonic device, consult reference sheets, complete practice worksheets, a review activity, and test their understanding with a metric conversion test. Teacher instructions and an answer key will help plan and prep this unit with ease. Like this activity? Check out the metric measurement bundle and save 20% by clicking here. Stu
Preview of Science Graphing Activity NGSS Middle School Earth Science

Science Graphing Activity NGSS Middle School Earth Science

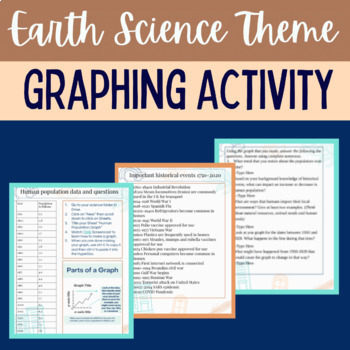
This resource is a cross-curricular lesson plan that supports NGSS Middle School Earth Science standards for Earth and Human Activity- human population and consumption. The lesson plan teaches students to build and interpret graphs in a science lesson with an integrated math activity. In this resource, students learn, using a Screencast, how to use a data chart to create a graph on a spreadsheet for use with Google Sheetsâ„¢. The second page includes a timeline of historical events, including the
Preview of Une représentation à l'échelle du système solaire - Solar system at the scale
Une représentation à l'échelle du système solaire - Solar system at the scale

Il s'agit d'un travail de mathématiques. Cette activité est à destination du collège, plus spécifiquement en classes de 5ème, de 4ème et de 3ème. On demande aux élèves de représenter le système solaire à l'échelle. On utilise le logiciel Geogebra ainsi qu'un tableur.L'idée n'est pas de dessiner le système solaire, mais bien d'en avoir une représentation à l'échelle aussi proche que possible. L'utilisation du logiciel Geogebra permet une visualisation qui n'est pas possible ou peu aisée sur papie
Preview of Scientific Method Independent and Dependent Variables Worksheet and Text
Scientific Method Independent and Dependent Variables Worksheet and Text

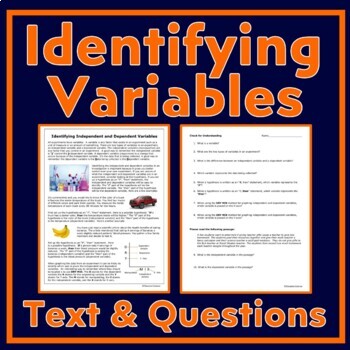
Middle school students learn the difference between independent and dependent variables in scientific experiments.This article and questions is also included in our Introduction to Variables Activity.In this activity, students will:Read an article explaining the difference between independent and dependent variablesAnswer basic follow-up check for understanding questions.Teacher Notes:Please note that this resource is not editable.Answer key included.Please consider clicking HERE to follow Eleva
Preview of Claim Evidence and Reasoning in the Core Classes
Claim Evidence and Reasoning in the Core Classes

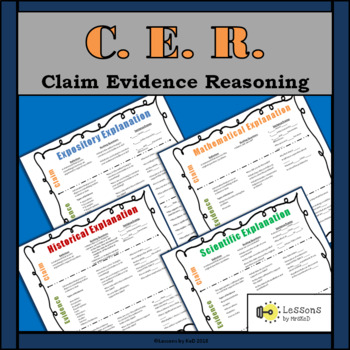
CER is not just for the science classroom! Students need to identify and analyze claims, evidence, and reasoning in all content areas! This resource helps students to develop their CER skills by providing:key terms defined according to each specific content areaexamples of different types of evidence used in each content areaguiding questions to help students identify the claim and evidencesentence frames to help students explain their reasoningThree formats included:With decorative bordersWitho
Preview of Metric Measurement Bell Ringers

Metric Measurement Bell Ringers

Created by
Teaching Muse
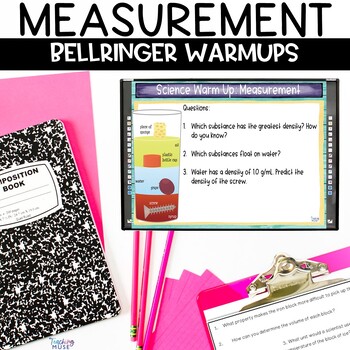
Review metric measurement during this back to school season using these bell ringer science warm ups. This measurement bellringer activity includes 20 questions about mass, length, volume, density, and temperature. Project the questions on your Smartboard for students to answer as they start class. Printable student sheets are also included. An editable version has been added to allow you to personalize this activity for your classroom. Like this daily warm up activity? Check out the metric meas
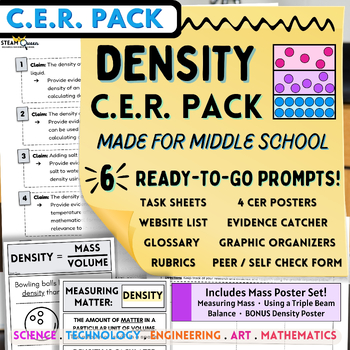
Preview of CER Density Scientific Arguments: 6 Claim Options, Posters & More! Middle School
CER Density Scientific Arguments: 6 Claim Options, Posters & More! Middle School

Created by
The STEAM Queen
Introducing our Density Scientific Argumentation CER Set - a comprehensive and engaging resource for science teachers looking for an accessible and interactive way to teach middle school students about density, how to calculate it, what it means, and its many applications and related concepts. Explore SIX different claims related to density, including how temperature changes can impact density, the relationship between density and buoyancy, density as a ratio of mass to volume, salinity and dens
Preview of STEM Project Journal and Rubrics

STEM Project Journal and Rubrics

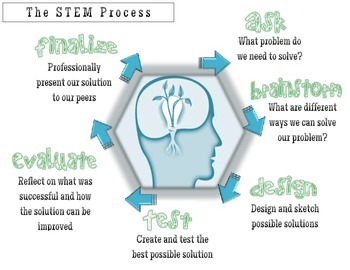
Generic STEM Project Journal for use with any project of your choice. Designed for students to work collaboratively in groups of three. Aligned with many Common Core Speaking and Listening Standards. Created with a fifth grade classroom in mind, but can easily be adapted for other grade levels. UPDATE: I have updated the journal to be less repetitive and more specific. I have also modified the rubrics to include the CCSS. Further, I have included a sample project at the end to reflect how I pre
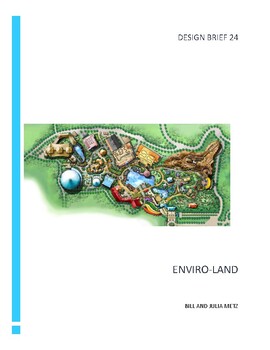
Preview of ENVIRO LAND - A DESIGN BRIEF

ENVIRO LAND - A DESIGN BRIEF

Created by
SCIENCEWORX
This design brief was developed as a general engineering brief but can be used for a variety of other purposes. For example, some students at the middle school level may still have difficulty in creating an overhead projection and as a result may have difficulty in reading and interpreting maps. An activity like this could prove helpful in identifying these students. Enviro-Land might also be used to reinforce the environmental issues the students have been studying as well as a venue for puttin
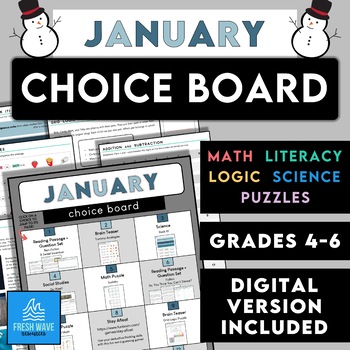
Preview of January Learning Choice Board - Month-Long Fun No Prep Activity Options
January Learning Choice Board - Month-Long Fun No Prep Activity Options

Want to know how to engage students, enthuse them, and bring out their best effort? Give them a voice in their decisions.This choice board is designed to give your student’s autonomy over their own learning- a natural differentiation technique. Students will choose from options in math, literacy, logic, science, social studies, and puzzles. A wonderful option for fast finisher work, sub plans, or enrichment. Depending on you choice of implementation (fast finisher work, etc.), this choice board
Preview of CER Measuring Volume Scientific Arguments: 6 Claim Options & More! Middle School

CER Measuring Volume Scientific Arguments: 6 Claim Options & More! Middle School

Created by
The STEAM Queen
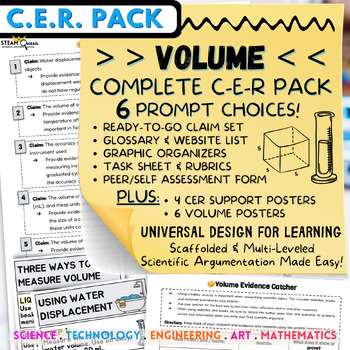
Introducing our Measuring Volume Scientific Argumentation CER Set - a comprehensive and engaging resource for science teachers looking for an accessible and interactive way to teach middle school students about volume, ways to measure it, what it means, and its many applications and related concepts. Explore SIX different claims related to volume, including measuring volume using water displacement and geometric formulas, how temperature changes can impact volume, the relationship between mL and
Showing 1-24 of 46 results

Find Math resources | TPT

Importance of learning math skills

It's no secret that mathematics is one of the foundational subjects that students need to learn. Math forms the basis for so many other subjects — like science, engineering, and technology — and because of that, it's essential that students develop strong math skills starting from a very young age.

Benefits of learning math

Learning math has many benefits. It helps students:

  • Begin to develop problem-solving, logical reasoning, and critical-thinking skills
  • Grow their understanding of numbers and basic operations
  • Understand how math is used in real-life situations

By ensuring that students have a solid foundation, teachers can help set them up for future success.

Discover printable and digital math resources

Math resources are an integral part of effective math education. On TPT, math resources come in various forms: from worksheets and full-year curricula to manipulatives and educational games. They can be used to enhance learning, assess student’s mastery of math concepts, and engage students in meaningful learning. By incorporating math resources from TPT into your teaching toolbox, you can create a rich learning experience that strengthens students’ understanding of math concepts and encourages a positive attitude toward math.

If you’re a teacher or parent looking for printable and digital math worksheets, TPT has an extensive collection of math resources across topics and grade levels. No matter what math topic your students are working on — whether you’re teaching numbers to kindergarteners or algebra to 9th graders — TPT has resources designed to help with any math learning need.

With a little encouragement and plenty of resources, TPT resources can make teaching and learning math so much easier. Plus, you can expand students’ knowledge even further by exploring TPT science resources, which are frequently paired with math lessons.

Frequently asked questions about math resources

What types of math lessons are available on TPT?

There are many different types of math resources sold by Sellers on TPT. Some popular math lessons include geometry, mental math, algebra, fractions, place value, measurement, and decimals.

How do I find math lessons on TPT?

Educators can save time preparing math lessons with resources created by experienced teachers. Simply start a search for math resources on the TPT marketplace, and filter by grade level, price, and/or resource type to find materials that've been proven to work in classrooms like yours. No matter what you’re teaching, there are plenty of math lessons and activities sold by Sellers on TPT that are tailored to meet your students' skill levels.

How do I support students struggling with math?

If your student or child is struggling with a specific math concept, you can provide extra support and resources such as math worksheets. Sometimes, visual aids like charts, graphs, and manipulatives can help children understand abstract concepts better.

How can I make math fun?

Students learn best when they're engaged! Sprinkle a little fun into your math lessons by using educational games, videos, puzzles, and real-life scenarios. If your class seems to find math boring or uninteresting, you can also try connecting lessons to their interests or hobbies. Encourage them to ask questions and explore mathematical concepts in different ways.