33 results
9th grade Common Core 6.SP.B.5 resources $5-10
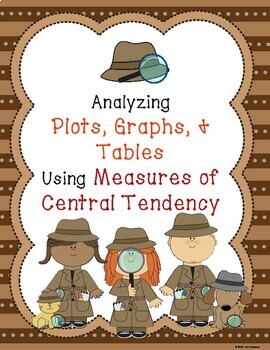
Analyzing Plots, Graphs, and Tables using Measures of Central Tendency
This product provides students the opportunity to analyze data presented in different ways. By making calculations and analyzing data, students make conjectures and justify them using mathematical reasoning and evidence!What is included?This product contains 8 student work pages. Each work page contains a set of data displayed graphically with accompanying questions. The data displays included are 2 dot plots, 2 bar graphs, 2 frequency tables, and 2 stem-and-leaf plots. Students are required
Subjects:
Grades:
5th - 11th
Types:
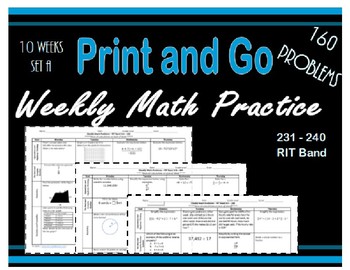
Daily Math Practice for RIT Band 231 - 240 Set A
This set of math practice worksheets provides students with daily (Monday through Thursday) math problems based on the skills outlined in NWEA's Learning Continuum for MAP testing. Each day, students solve four problems, one problem per math goal:
*Operations and Algebraic Thinking,
*Real and Complex Number Systems,
*Geometry, and
*Statistics and Probability.
These practice problems are designed to provide students with a vast exposure to the 231 – 2
Subjects:
Grades:
6th - 9th
Types:
Also included in: Daily Math Practice for RIT Band 231 - 240 Bundle

Stock Market Game - Stock Market Simulation Game for Middle and High School
THE STOCK MARKET GAME! Create a virtual Stock Exchange in your own classroom and allow students to experience the basics of investing!In The Stock Market Game, students are introduced to the foundations of investing and how the stock market actually works. Open their eyes to new possibilities and teach them a tool they can use to improve their financial future! (While implementing essential math standards, of course!)The Stock Market Game includes everything you need set the stage and experience
Subjects:
Grades:
6th - 12th
CCSS:
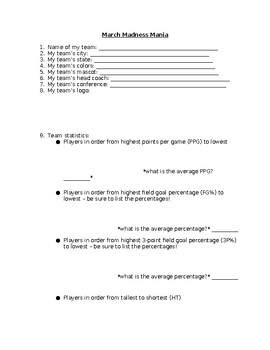
NCAA March Madness Basketball Tournament Team Research Statistics
Do you have students interested in the March Madness basketball tournament? Then this is the activity you need!To begin our March Madness unit, we look at all of the teams participating in the tournament and complete a map together to show where each team is from. We notice that some states have more than others and some states have none, and spend time discussing why that might be. Students will complete their own March Madness bracket.Students will then select a team in the NCAA March Madness
Grades:
4th - 9th
Types:
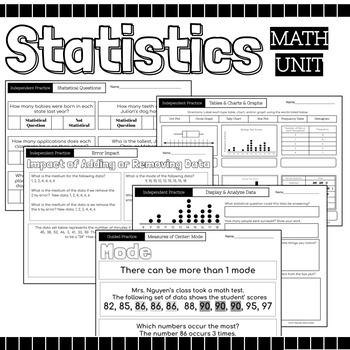
Statistics Math Packet {Data, Charts, Graphs, Mean, Median, Mode, Range, Spread}
52 Page Statics Unit Includes: Guided Instruction & Independent Practice Pages Usage Suggestions and IdeasThis resource can be utilized in numerous ways, here are some ideas:use for guided practiceassign as partner workassign as independent practicecan be used for morning workuse for reteaching in small group settinguse as review prior to assessmentuse as review in continuing to strengthen skillassign for homeworkuse as independent work during math centersTopicsRecognize Statistical Question
Subjects:
Grades:
4th - 12th
Probability Project: March Madness
In this project, student will use their data analysis skills to research each teams' chance of winning the NCAA Tournament. Students will also use probability to fill in their own brackets for the tournament. This lesson is a fun way to incorporate March Madness into the math classroom.
Subjects:
Grades:
6th - 10th
Types:

Fun with Ratios Activities Bundle - 7th Grade PBL with Math
The purpose of the Fun with Ratios Activities Bundle is to give students the opportunity to use creativity to apply ratios, proportions, and percentages in real-world settings. This bundle includes three unique tasks: Black Friday Mastery Task, Direct Variation Poster Mastery Task, and the Unique Survey Project. These activities and their accompanying materials are suited for students in grades 7 through 9. These lessons make excellent sub plans. Each project takes approximately two 60-minute bl
Subjects:
Grades:
7th - 9th
Types:
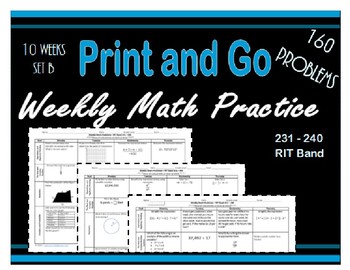
Daily Math Practice for RIT Band 231 - 240 Set B
This set of math practice worksheets provides students with daily (Monday through Thursday) math problems based on the skills outlined in NWEA's Learning Continuum for MAP testing. Each day, students solve four problems, one problem per math goal:
*Operations and Algebraic Thinking,
*Real and Complex Number Systems,
*Geometry, and
*Statistics and Probability.
These practice problems are designed to provide students with a vast exposure to the 231 – 2
Subjects:
Grades:
6th - 9th
Types:
Also included in: Daily Math Practice for RIT Band 231 - 240 Bundle
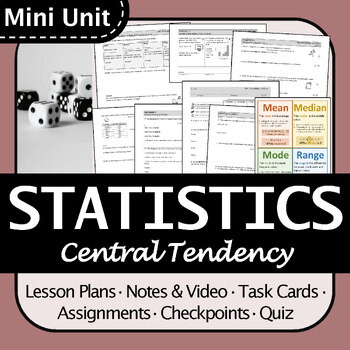
BC Math 8 Measures of Central Tendency Mini Unit, Engaging, Differentiated
This is an engaging mini unit that would work great for an in-depth look at measures of central tendency (mean, median, mode, and range) and how to choose them. The resources are well-organized and differentiated so they are accessible to a wide range of students.Students learn:How to calculate mean, median, mode, and range from a data set or frequency table.How to choose the best measure of central tendency (mean, median, or mode) given a particular situation or data set. Includes:Detailed les
Subjects:
Grades:
6th - 9th
Types:
Daily Math Practice for RIT Band 231 - 240 Set C
This set of math practice worksheets provides students with daily (Monday through Thursday) math problems based on the skills outlined in NWEA's Learning Continuum for MAP testing. Each day, students solve four problems, one problem per math goal:
*Operations and Algebraic Thinking,
*Real and Complex Number Systems,
*Geometry, and
*Statistics and Probability.
These practice problems are designed to provide students with a vast exposure to the 231 – 2
Subjects:
Grades:
6th - 9th
Types:
Also included in: Daily Math Practice for RIT Band 231 - 240 Bundle
Middle School Survey Statistics Project Bundle
DescriptionA bundle of all materials needed for my Middle School Survey Project! Perfect for an end of year or statistics unit project.A fun, engaging, and active way for students to explore the foundations of statistical analysis and modeling.In this project students are tasked with creating a statistical question, surveying two relevant populations, calculating the measures of center and variability, making a dot plot, histogram, and box-and-whisker plot, and analyzing their data.Included in t
Subjects:
Grades:
6th - 9th

Ecology: Modelling Energy Flow In A Community
This digital product introduces how energy flows through habitats in a community and the types of niches found in a community. Feeding relationships are explored, including producer/ consumer, symbiosis and predator/ prey. Food chain and food web models are examined and made, as are Energy Pyramids and the Pyramid of Numbers via a foldable product (or digital product). Population changes are introduced along with limiting factors and their impact on the carrying capacity in a population. Include
Subjects:
Grades:
5th - 9th
Types:
NGSS:
MS-LS2-2
, MS-LS2-3
, 5-LS2-1
, MS-LS2-4
, MS-LS2-1
...
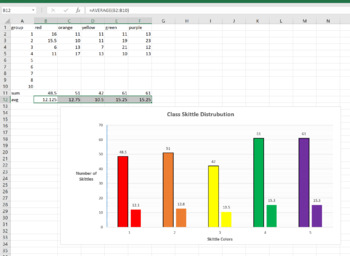
Skittle Statistics MS Excel Mini-Lab
This is a 1 class MS Excel lab for a computer or math class. You can have the students explore the distribution of different color Skittles in class. This is a great mini-lab or half-day activity when you school ends up with a weird schedule day. Tell them they can't eat till the Skittles till the end of class, or they will distort their numbers. Also make sure they don't throw them or shove them up their nose (Yes, stuck Skittles are hard to extract, ask me how I know..)The goal of this lab is
Grades:
6th - 12th, Higher Education, Adult Education
Types:
NGSS:
MS-ETS1-2
, HS-ETS1-2
, HS-ETS1-3
, MS-ETS1-4
, MS-ETS1-1
...
Also included in: Hands-on Science Semester Labs Bundle
Statistics Digital Unit: Math Stats Lesson & Activities {Google Slides}
Digital Statistics UnitThis Digital Resource can be used as-Google SlidesGoogle Classroom AssignmentAdd to Google DriveUse a PowerPointAssign via other digital meansUsage Suggestions and IdeasThis resource can be utilized in numerous ways, here are some ideas:use for guided practiceassign as partner workassign as independent practicecan be used for morning workuse for reteaching in small group settinguse as review prior to assessmentuse as review in continuing to strengthen skillassign for homew
Subjects:
Grades:
4th - 9th
Types:
Central Tendency, Dot Plots, Box & Whisker Plots - The Notebook Curriculum
The Algebra concepts in the first PowerPoint focus on Central Tendency: Mean, Median, Mode, and Range. During this lesson, we review the meaning of each central tendency concept and go over two examples of how to calculate each, including calculating the average of the two middle values to find the Median.The Algebra concepts in the second PowerPoint focus on Dot Plot Graphs and the Central Tendency concepts calculated from its values: Mean, Median, Mode, and Range. During this lesson, we go ove
Subjects:
Grades:
6th - 12th
Measures of Center - EDITABLE Slides, Notes, INB & Test+++ Drive Math
Drive Instruction with instructional resources that live in the cloud on Google Drive! All of the docs are COMPLETELY EDITABLE and can be differentiated to meet your needs or the needs of your students. PDFs are also included in the download if you prefer them that way. Each Drive Instruction set includes warm-ups, exit tickets, notes, presentations, digital interactive notebooks and tests. These are designed to be complementary to all of my innovative supplemental resources and an improvement o
Subjects:
Grades:
6th - 10th
Also included in: Measures of Center & Variance Unit Bundle - Distance Learning Compatible
Cone Zone: A Comprehensive S.T.E.A.M. Activity
Students will design a cone-shaped descent chute for a planetary landing craft to optimize stability and minimize speed in this engaging lesson. This activity lends itself to student scientists of many ages. Young learners will benefit from simply creating the cones and testing their effectiveness. Older students can use spreadsheets that they create to analyze the data on a much more sophisticated level.
Grades:
5th - 9th
Types:
CCSS:
NGSS:
MS-ETS1-2
, 3-5-ETS1-3
, MS-ETS1-4
, 3-5-ETS1-2
, MS-ETS1-3
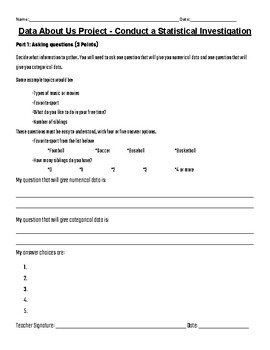
Data Project - Conducting a Statistical Analysis
This data project was created to use at the end of the Connected Math Unit "Data About Us" but it can be used at the culmination of any 5th, 6th, or 7th-grade data unit. It can also be used at any grade level as an enrichment activity or to review statistical data.
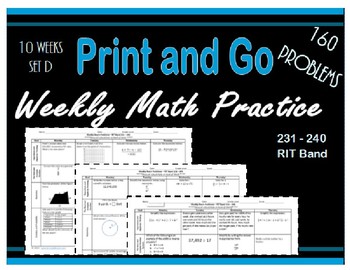
Daily Math Practice for RIT Band 231 - 240 Set D
This set of math practice worksheets provides students with daily (Monday through Thursday) math problems based on the skills outlined in NWEA's Learning Continuum for MAP testing. Each day, students solve four problems, one problem per math goal:
*Operations and Algebraic Thinking,
*Real and Complex Number Systems,
*Geometry, and
*Statistics and Probability.
These practice problems are designed to provide students with a vast exposure to the 231 – 2
Subjects:
Grades:
6th - 9th
Types:
Also included in: Daily Math Practice for RIT Band 231 - 240 Bundle
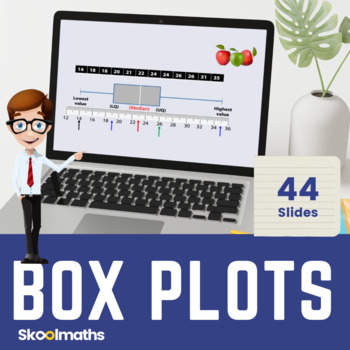
Box and Whisker Plots Digital Lesson and Activities for Middle School
Box and Whisker Plots Digital Lesson and Activities for Middle SchoolBox Plots is a completely interactive lesson designed for Middle school to High School Statistics and Probability.Contents:This bundle pack contains:44 interactive slides with dynamic graphics that will engage your studentsInteractive Drag and Drop activities on find averages as well as instant learner feedbackPrintable Worksheets with answers includedDifferentiated questions and answersCan be used as Home Learning Resource and
Subjects:
Grades:
6th - 9th
Also included in: Complete Statistics and Probability Bundle | Digital and Print
Statistics Project
Students will create a research question, survey their classmates, perform statistical calculations, and create a histogram and boxplot.
Question Bank-Quantitative vs. Categorical Data (pdf)
Question Bank pdf file100 Questions10 True False10 Yes No10 Completion10 MC10 Multi Response10 Matching10 Short Answer10 Image Problem Based10 Case Scenario10 Investigative TasksWith DOK, Solutions, Rubrics When Applicable, Standards
Subjects:
Grades:
6th - 12th, Higher Education, Adult Education
Types:
CCSS:
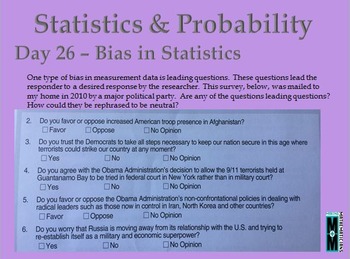
Statistics and Probability Daily Math Slides
These 35 slides focusing on Statistics and Probability are intended to show students the beauty and inter-connectedness of mathematics. These slides can be used as warm-ups or bell ringers or to launch a lesson. Each slide could lead to an extended project or math center. The slides are appropriate for grades 3-12 because they are open-ended or have animation geared to different grade levels. If you purchase all 5 strands of daily math slides you can buy it for a reduced bundled price of $20
Subjects:
Grades:
3rd - 12th
29:21
6th Grade Math Mod 6 Stem & Leaf Day 1 Video Lesson Mean Median Mode Flipped
6th Grade Math Module 6 Video Lesson covering How to Create a Stem & Leaf Plot Day 1 is ready to go! Are you considering Flipped Learning this coming year? Will students be learning virtually, and you want them to have access to video lessons they can refer to for extra help? Do you plan on having your students home-schooled this coming year and you want them to get the same instruction they would if they were attending an in-person classroom? Teachers, do you sometimes wonder what you will
Subjects:
Grades:
4th - 10th, Adult Education
Types:
Showing 1-24 of 33 results


