TPT
Total:
$0.00

Measures of Center & Variance Unit Bundle - Distance Learning Compatible

Rated 4.9 out of 5, based on 6 reviews
4.9 (6 ratings)
;
Clark Creative Math
17.4k Followers
Grade Levels
6th - 12th, Homeschool
Resource Type
Standards
Formats Included
  • Zip
  • Google Apps™
Pages
150+
$35.00
List Price:
$98.00
You Save:
$63.00
Bundle
$35.00
List Price:
$98.00
You Save:
$63.00
Bundle
Share this resource
Report this resource to TPT
Clark Creative Math
17.4k Followers
Includes Google Apps™
This bundle contains one or more resources with Google apps (e.g. docs, slides, etc.).

Products in this Bundle (37)

    showing 1-5 of 37 products

    Bonus

    Clark Creative Math User Guide

    Description

    This is a selection of my Measures of Center & Variance resources all in a money saving Essential Bundle! You save significant money and time versus purchasing these separately!

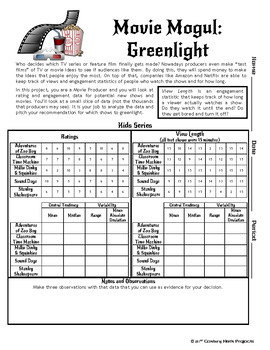
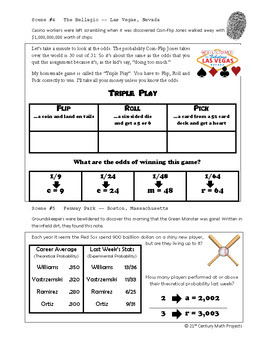
    Essential Bundles are designed to give you everything you need to rock your unit. Warmups, Notes, Activities, Games, Exit Tickets, and Tests. You will find a selection of my Drive Instruction, Escapes, Boot Camp, Adventures, Whodunnits, CSI, Person Puzzles, STEM-ersions, Herowork, TableTop and my 21st Century Math Projects. The content of the bundle is subject to change as I add new brands.

    ***If the individual resource has Distance Learning in its title, there is a Google Slides version that has been added to it***

    If you need to ratchet engagement to the next stratosphere with a COMPLETE CURRICULUM with over 4,000+ pages of content.
    21st Century Pre-Algebra –- the Entire Curriculum

    Looking for more Pre-Algebra units?

    Real Number System

    Integers

    Rational Numbers

    Order of Operations

    Exponents & Roots

    Greatest Common Factor & Least Common Multiple

    Variables & Expressions

    Ratio & Proportion

    Percent

    Shape Classification

    Area & Perimeter

    Volume & Surface Area

    Coordinate Plane

    Distance & Midpoint

    Transformations

    Scientific Notation

    Data Displays & Analysis

    Measures of Central Tendency & Variance

    Probability & Expected Value

    For more tips, tricks and ideas check out the Clark Creative Education Blog

    And join our community where I post ideas, anecdotes, elaborations & every once in a while I pass out TPT gift cards! And jokes! I do jokes too!

    Clark Creative Education Facebook Page

    Terms of Use

    This product includes a license for one teacher only for personal use in their classroom. Licenses are non-transferable, meaning they can not be passed from one teacher to another. No part of this resource is to be shared with a colleague or used by an entire grade level, school, or district without purchasing the proper number of licenses. If you are a coach, principal, or district interested in transferable licenses to accommodate yearly staff changes, please contact me for a quote at teach@clarkcreativeeducation.com

    This resource or answers to the questions may not be uploaded to the internet where it is publicly available in any form including classroom/personal websites, network drives or student Prezis (can be made private), unless the website or app is password protected and can only be accessed by students.

    Thank you for respecting my work!

    Total Pages
    150+
    Answer Key
    Included
    Teaching Duration
    N/A
    Report this resource to TPT
    Reported resources will be reviewed by our team. Report this resource to let us know if this resource violates TPT’s content guidelines.

    Standards

    to see state-specific standards (only available in the US).
    Recognize a statistical question as one that anticipates variability in the data related to the question and accounts for it in the answers. For example, “How old am I?” is not a statistical question, but “How old are the students in my school?” is a statistical question because one anticipates variability in students’ ages.
    Understand that a set of data collected to answer a statistical question has a distribution which can be described by its center, spread, and overall shape.
    Recognize that a measure of center for a numerical data set summarizes all of its values with a single number, while a measure of variation describes how its values vary with a single number.
    Summarize numerical data sets in relation to their context, such as by:
    Giving quantitative measures of center (median and/or mean) and variability (interquartile range and/or mean absolute deviation), as well as describing any overall pattern and any striking deviations from the overall pattern with reference to the context in which the data were gathered.

    Reviews

    Questions & Answers

    17.4k Followers