6 results
12th grade Common Core 6.SP.B.5 resources $5-10
Sponsored

Stock Market Game - Stock Market Simulation Game for Middle and High School
THE STOCK MARKET GAME! Create a virtual Stock Exchange in your own classroom and allow students to experience the basics of investing!In The Stock Market Game, students are introduced to the foundations of investing and how the stock market actually works. Open their eyes to new possibilities and teach them a tool they can use to improve their financial future! (While implementing essential math standards, of course!)The Stock Market Game includes everything you need set the stage and experience
Subjects:
Grades:
6th - 12th
CCSS:
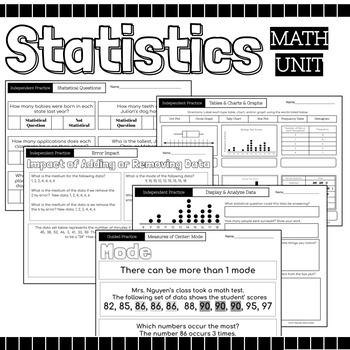
Statistics Math Packet {Data, Charts, Graphs, Mean, Median, Mode, Range, Spread}
52 Page Statics Unit Includes: Guided Instruction & Independent Practice Pages Usage Suggestions and IdeasThis resource can be utilized in numerous ways, here are some ideas:use for guided practiceassign as partner workassign as independent practicecan be used for morning workuse for reteaching in small group settinguse as review prior to assessmentuse as review in continuing to strengthen skillassign for homeworkuse as independent work during math centersTopicsRecognize Statistical Question
Subjects:
Grades:
4th - 12th
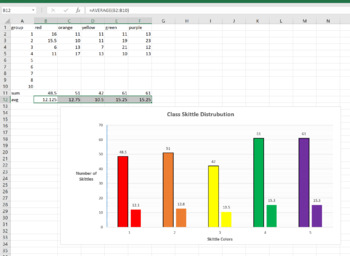
Skittle Statistics MS Excel Mini-Lab
This is a 1 class MS Excel lab for a computer or math class. You can have the students explore the distribution of different color Skittles in class. This is a great mini-lab or half-day activity when you school ends up with a weird schedule day. Tell them they can't eat till the Skittles till the end of class, or they will distort their numbers. Also make sure they don't throw them or shove them up their nose (Yes, stuck Skittles are hard to extract, ask me how I know..)The goal of this lab is
Grades:
6th - 12th, Higher Education, Adult Education
Types:
NGSS:
MS-ETS1-2
, HS-ETS1-2
, HS-ETS1-3
, MS-ETS1-4
, MS-ETS1-1
...
Also included in: Hands-on Science Semester Labs Bundle
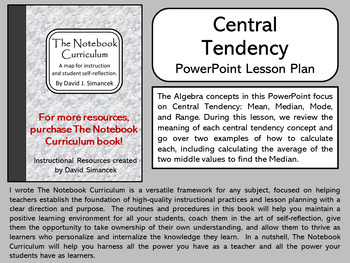
Central Tendency, Dot Plots, Box & Whisker Plots - The Notebook Curriculum
The Algebra concepts in the first PowerPoint focus on Central Tendency: Mean, Median, Mode, and Range. During this lesson, we review the meaning of each central tendency concept and go over two examples of how to calculate each, including calculating the average of the two middle values to find the Median.The Algebra concepts in the second PowerPoint focus on Dot Plot Graphs and the Central Tendency concepts calculated from its values: Mean, Median, Mode, and Range. During this lesson, we go ove
Subjects:
Grades:
6th - 12th
Question Bank-Quantitative vs. Categorical Data (pdf)
Question Bank pdf file100 Questions10 True False10 Yes No10 Completion10 MC10 Multi Response10 Matching10 Short Answer10 Image Problem Based10 Case Scenario10 Investigative TasksWith DOK, Solutions, Rubrics When Applicable, Standards
Subjects:
Grades:
6th - 12th, Higher Education, Adult Education
Types:
CCSS:
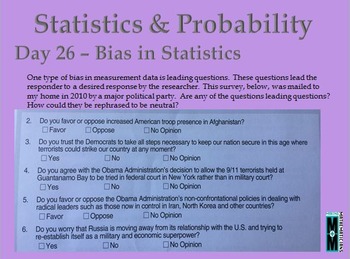
Statistics and Probability Daily Math Slides
These 35 slides focusing on Statistics and Probability are intended to show students the beauty and inter-connectedness of mathematics. These slides can be used as warm-ups or bell ringers or to launch a lesson. Each slide could lead to an extended project or math center. The slides are appropriate for grades 3-12 because they are open-ended or have animation geared to different grade levels. If you purchase all 5 strands of daily math slides you can buy it for a reduced bundled price of $20
Subjects:
Grades:
3rd - 12th
Showing 1-6 of 6 results


