98 results
Kindergarten graphing resources for Easel Activities under $5
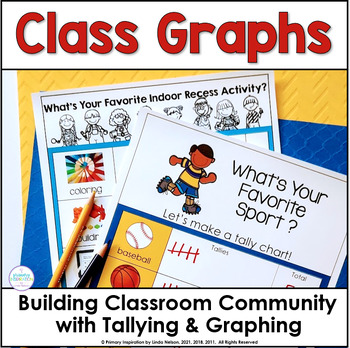
Bar Graphs & Tally Marks - Graphing Math Data to Build Classroom Community
This fun set of graphing activities gives your students lots of relevant practice collecting and interpreting data with ready-to-use bar graphs and tally mark charts. Plus, it builds classroom community and develops meaningful connections! Here's what this graphing and tallying resource includes!➯ 23 one page horizontal and vertical bar graphs designed to build classroom community as your students learn about how they are alike and different. Topics range from favorite foods, sports, and books,
Subjects:
Grades:
K - 3rd
Types:
CCSS:
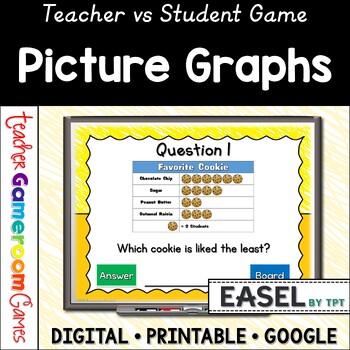
Pictographs Powerpoint Game | Picture Graphs | Digital Resources | Graphs & Data
Pictographs game! Students will answer questions about two picture graphs. Questions include most/least favorites, totals for each group, and comparing groups. There are 2 graphs in this game, each with 10 questions, giving you a total of 20 questions. The question disappears after you've clicked on it, so you know you've answered it. The scoreboard allows you to add scores during Slideshow Mode. Great digital resource for a quick math morning review or center activity. Great for individual prac
Subjects:
Grades:
K - 3rd
Also included in: Graphs Bundle | No Prep Digital Resources
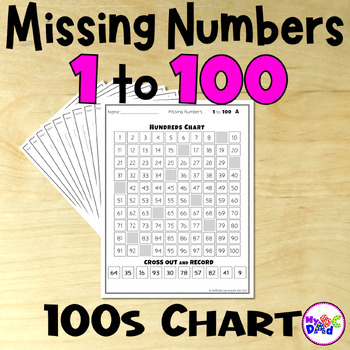
100s Chart Missing Numbers 1 to 100 Math Activities - No Prep
Students will love learning numbers 1 to 100 with a set of ten highly engaging, no prep, print and go missing numbers activities. These activities are a creative way to practice number skills from 1 to 100 on a hundreds chart and can be completed independently. Activities are self-checking with hundreds charts and number clues all on one page. Help inspire number knowledge this year with these fun math activities.What’s included:➯ PDF includes 10 worksheets (2 versions, one with supportive numbe
Grades:
K - 1st
Types:
CCSS:
Also included in: 100s Chart Missing Numbers 1 to 100 and 1 to 1000 Math Activities BUNDLE
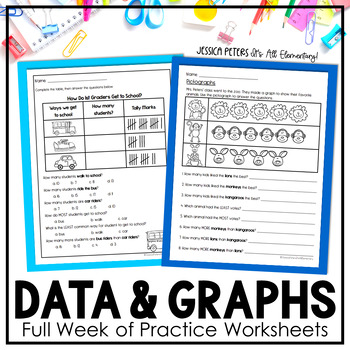
Data and Graphing Worksheets | Bar Graphs, Pictographs, Tally Charts | 1st Grade
Full week of Graphing and Data Worksheets for practice, homework, and assessment. Bar graphs, pictographs, tally marks, and table included. Appropriate for Kindergarten, 1st grade, and 2nd grade. If you are teaching graphing lessons next week, this should get you out the door more quickly! This packet includes a full week of practice worksheets, HW worksheets, and a test on graphing and data. Please note: I recently update this file to remove the large black heading at the top right of each page
Subjects:
Grades:
K - 2nd
Types:
CCSS:
COLLECT AND COMPARE DATA GRAPHS TALLY MARKS OBJECTS READY MAF 1st Grade Math
TALLY GRAPHS AND PICTURE GRAPHSProduct DescriptionThis math pack is a great addition to any Math Curriculum for first grade. This product has extensive practice for students who are learning to understand how sort and compare object (with addition and subtraction equations) how to read complete tally and picture graphs. There are opportunities to compare data utilizing word problems.This pack is a great addition to any Math Curriculum for kinder and first grade. There are 29 differentiated works
Subjects:
Grades:
K - 2nd
Types:
Also included in: iReady 2020 Update Bundle - Supplemental Resources for 1st Grade Math
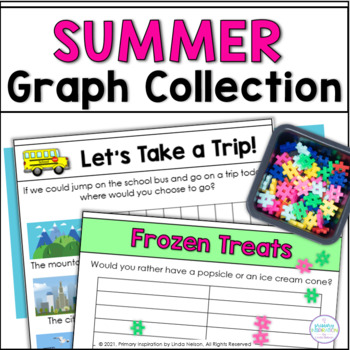
Summer Math - Bar Graphs and Tally Marks - June Activities - End of the Year
Celebrate the end of the year with a summer math festival featuring this set of 24 graphing and tally marks activities. These engaging bar graph and data analysis activities will keep your vacation-minded students learning all through June and in summer school, too!Use any or all of these graphing activities as stand alone activities or as part of your data and graphing unit, as either a whole class or small group activity. Here are some of the topics included in this summer math data collectio
Grades:
K - 2nd
Types:
Also included in: Summer School ESY Math and Literacy Bundle - June July Activities
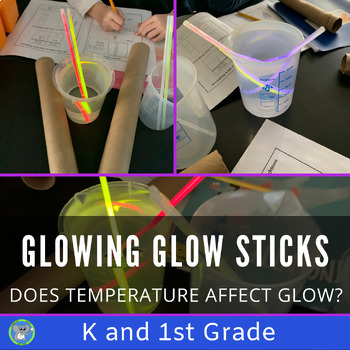
Glow Stick Light Experiment | Grade K 1 2 Chemical Reaction Science Activity
Excite students by investigating how temperature affects the brightness of glowsticks. This experiment uses simple supplies and includes detailed directions to guide the teacher and students. NGSS Aligned, fun, and perfect for Halloween.Students will follow the scientific method to answer the question:Does temperature affect the brightness of a glow stick? The journal meets the K-2 Science and Engineering Practices in NGSS.Teachers will like its’ ease of use, simple materials, and background inf
Subjects:
Grades:
K - 2nd
NGSS:
K-2-ETS1-3
, 1-PS4-2
Also included in: Chemical Reaction Bundle | The Science Of Glow Sticks | Light Activity
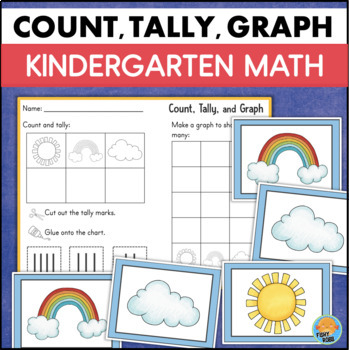
Kindergarten Counting Objects to 5 Sorting Creating Simple Graphs Tally Marks
This is a set of sorting, counting, and graphing activities for kindergarten. It's a great way to introduce young learners to the concept of data collection.These activities involve matching, sorting, counting sets of objects, representing numbers, cutting and pasting.INCLUDES:5 different sets of sorting/counting cards (total of 50 cards)5 graphing worksheetsAnswer keysDigital activitiesAfter giving students a set of cards to work with, they will:sort the cardscount how many there are of each ob
Grades:
K
Types:
CCSS:
Also included in: Kindergarten Math BUNDLE Ways to Show A Number ID Counting Objects to 10
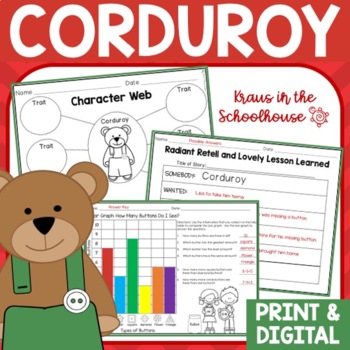
Corduroy Book Activities | Easel Activity Distance Learning
Printable and TpT digital activities are included for kids to use after reading Corduroy. Kindergarten, first grade, and second grade students will enjoy these fun activity sheets. This book study provides your students with reading, writing, and math activities. This resource has a Easel Activity for distance learning already created for students to input their responses in answer boxes and to use other tools to draw and highlight. It is an Interactive layer over the original pdf. Click he
Subjects:
Grades:
K - 2nd
Also included in: Book Study Bundle | Favorite Read Aloud Books | Picture Books
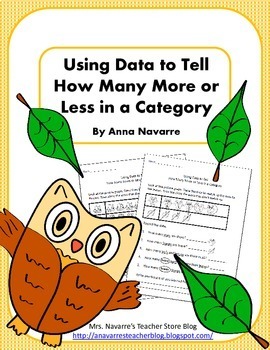
Using Data to Tell How Many More or Less
This Using Data to Tell How Many More or Less in a Category is a great beginning picture graph resource. Students compare numbers (pictures) by drawing lines in order to determine the difference between the two sets. Students then use the picture graph to answer questions about the graph and determine which category has more and which has fewer. Includes:This set includes 10 easy to use practice pages. Be sure to check out the preview to see more. Easel Activities - There are two versions of thi
Producers and Consumers
These Producer and Consumer activities were designed as a cross-curricular social studies unit (Reading, Social Studies, and Math) Activities on producers, consumers, goods, and services are included in these print and go activities.
This product is part of my Economics Bundle. Click on the link below to check out the bundle and save money!
Economics Bundled Unit!
What’s Included?
1. Word Wall Posters: (Consumer, Producer, Goods, & Services)
2. We are Producers Mini Book (One in colo
Subjects:
Grades:
K - 2nd
Types:
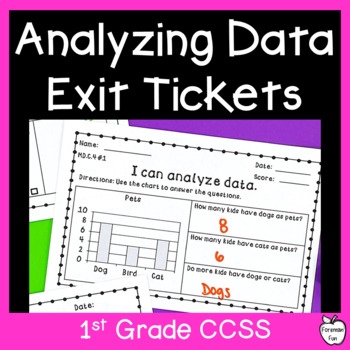
Bar Graph & Tally Chart Exit Tickets - Analyze Data - 1st Grade Math Assessment
Need a quick way to assess student knowledge of data analysis and graphs? This pack includes 8 exit slip assessments on analyzing bar graphs and tally charts. There are 4 exit tickets on bar graphs and 4 on tally charts. These are perfect to use as a quickcheck for student understanding after a lesson. You could also use one exit slip as a pre-assessment to make your guided groups. Then use a different one as a post-assessment to show growth and identify any students who may need reteaching. The
Grades:
K - 2nd
Types:
CCSS:
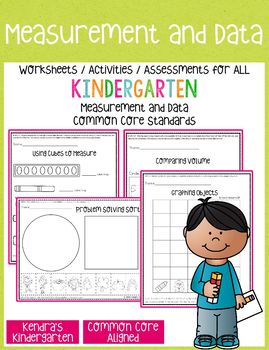
Measurement & Data Activities for Kindergarten - Common Core / Distance Learning
This is a packet of worksheets, assessments and activities designed to help teach the Measurement and Data Common Core Standards for Kindergarten. It has been updated for 2017.Worksheets for ALL Kindergarten Measurement and Data Common Core Standards are included.***Digital version for distance learning included!***Included in this packet:*Measurement Sentences Fill In (K.MD.1)*Measurement Sentences (K.MD.1)*Comparing Length (K.MD.2)*Comparing Weight (K.MD.2)*Comparing Volume (K.MD.2)*Using Cub
Subjects:
Grades:
K
Types:
Also included in: Kindergarten Math Common Core Bundle
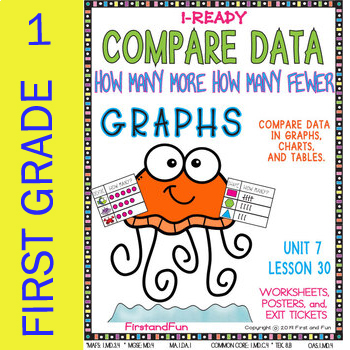
GRAPHS COMPARE OBJECTS HOW MANY MORE HOW MANY LESS UNIT 7 LESSON 30 READY MAF
First GradeTALLY GRAPHS AND PICTURE GRAPHSProduct DescriptionThis math pack is a great addition to any Math Curriculum for first grade. This product has extensive practice for students who are learning to understand how sort and compare object, how to read complete tally and picture graphs. There are 32 DIFFERENTIATED worksheets total. 22 are practice sheets, 10 are exit tickets, and 7 of which have answer keys. The Exit Tickets come with “I Can Statements” The Exit tickets have answer keys, whi
Subjects:
Grades:
K - 2nd
Types:
Also included in: IReady Math Complete Unit 7 Bundle How Many? How Much? How Long?
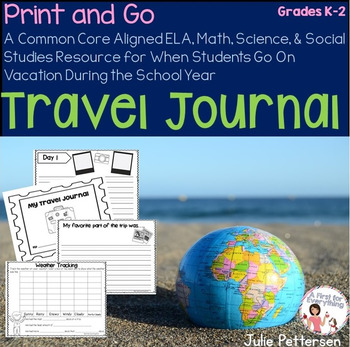
Travel Journal
Travel Journal: This comprehensive travel journal resource has activities for ELA, Math, Social Studies, and Science that are aligned to the Common Core Standards. It is perfect when students travel. Students can share their completed travel journal with the class when they return, add it to the classroom library, or leave it on display in the writing area.
*************************************************************************
Do parents ask you for work for their child when they go on vacati
Subjects:
Grades:
K - 2nd
Types:
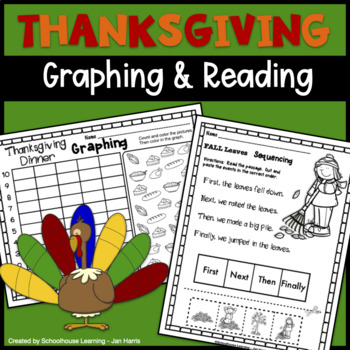
Thanksgiving Graphing & Reading Activity
Want some activities for Thanksgiving? Look no further. I hope you enjoy these graphing and reading activities.Please be sure to give feedback and earn TpT credits for more great products. by leaving me feedback. Your comments are always welcome and appreciated. Follow me for more great products!Check out my store at: Schoolhouse Learning - Jan Harris
Subjects:
Grades:
K - 1st
Types:
M & M Graphing for Any Time of Year with Easel Activity
Sometimes it is fun to do M & M's counting and graphing at different times of the year on birthdays, holidays, or as a treat. It can be a great experiment to see if results change depending on the time of year, too. Try it at Halloween, then repeat for Thanksgiving, Christmas, Valentine's, St. Patrick's Day and Easter. Compare the results. Students love it! Has teacher directions, two M & M's sorting mats in color or black and white, a tally sheet with questions, a bar graph worksheet, a
Grades:
K - 3rd
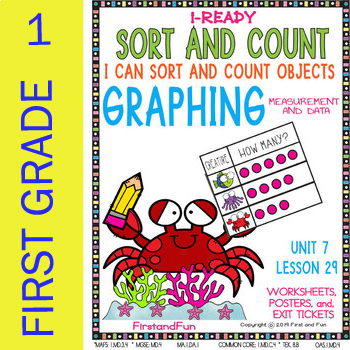
SORTING AND COMPARING OBJECTS GRAPH UNIT 7 LESSON 29 MAFS MGSE OAS TEK COMMON
First GradeUNDERSTANDING SORTING AND COMPARING OBJECTS GRAPH UNIT 7 LESSON 29 MAFS MGSE OAS TEK COMMON CORE TALLY GRAPHS AND PICTURE GRAPHSProduct DescriptionThis math pack is a great addition to any Math Curriculum for first grade. This product has extensive practice for students who are learning to understand how sort and compare object, how to read complete tally and picture graphs There are 32 DIFFERENTIATED worksheets total. 23 are practice sheets, 9 are exit tickets, and 5 of which have
Subjects:
Grades:
PreK - 2nd
Types:
Also included in: IReady Math Complete Unit 7 Bundle How Many? How Much? How Long?
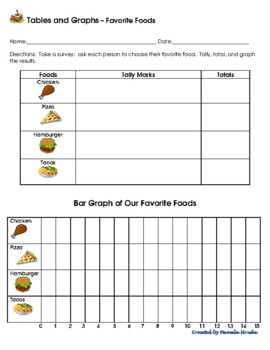
2 Tally Marks Tables & Bar Graphs - Favorite foods & desserts
2 Tally Marks Tables & Bar Graphs – Favorite Foods & Favorite DessertsVocabulary: survey, data, tally marks, bar graph. Directions: Activate prior knowledge about vocabulary words; display student answers. Discuss what it means to take a survey. How can we display our data? Explore different types of graphs (bar, line, picture, pie, histogram). Discuss/model tally marks. How do we use them? How does skip-counting help us here? Students take a survey of their classmates’ favorite food (or
Subjects:
Grades:
K - 3rd
Types:
Also included in: 7 Tally Marks Tables & Longitudinal Bar Graphs BUNDLE
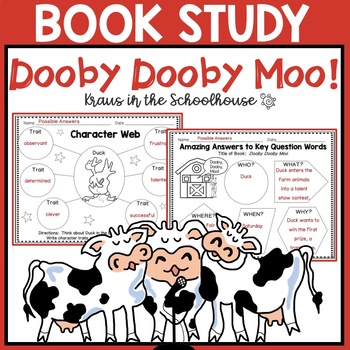
Dooby Dooby Moo Activities
Are you looking for Dooby Dooby Moo activities for your students? Dooby Dooby Moo written by Doreen Cronin is the perfect book study for Kindergarten, first grade, and second grade students. Fun activity sheets and worksheets are included for reading, writing, and math activities. This resource includes:Doreen Cronin fact sheet and web fact graphic organizerCharacter webs for Duck and Farmer Brown (with possible answers)Story elements graphic organizer (with answer key)Wh- questions graphic org
Subjects:
Grades:
K - 2nd
Also included in: Doreen Cronin Author Study Activities
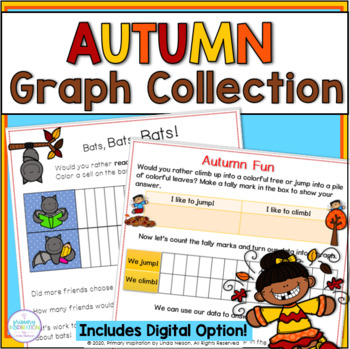
Autumn Graphs and Tally Marks - Fall Data Collection Activities
If you've been looking for an easy prep effective way to give your kindergarten or first grade class more practice with creating and interpreting tally marks and graphs, here's a set of 23 autumn class graphs that you'll love!Graphs in this set include favorite fall activities, favorite apple recipes, bat writing vs. bat reading, candy corn favorites, being helpful in fall, Johnny Appleseed, climbing trees vs. jumping in a leaf pile, beautiful spiders, and more. There are no scary Halloween top
Grades:
K - 1st
Types:
CCSS:
Also included in: Kindergarten Autumn Math and Literacy Bundle
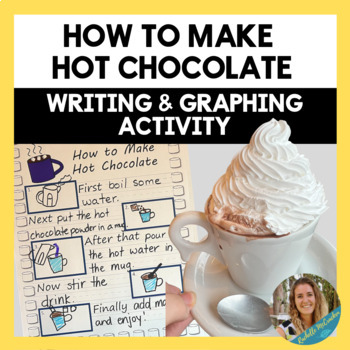
How to Make Hot Chocolate - Transitional Words and Sequencing Writing Activity
This is a wonderful winter activity! Kids will practice using transitional words by planning out their writing with a step-by-step procedure on how to make hot chocolate. Students can also survey the class on how they prefer their hot chocolate and then make a bar graph with the graphing page provided. The teacher can provide the materials for the kids to make hot chocolate and use this resource to supplement the activity! This download includes:-Materials list-Picture/craft of hot chocolate-Pos
Grades:
K - 4th
Types:
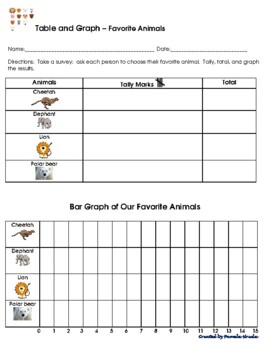
2 Tally Marks Tables & Bar Graphs - Favorite animals & pets
2 Tally Marks Tables & Bar Graphs – Favorite Animals & Favorite PetsDirections:Discuss what it means to take a survey. How can we display our data?Discuss tally marks. How do we use them?Students take a survey of their classmates’ favorite animal (or favorite pet), recording tally marks in the chart.Discuss how we make bar graphs. Students use their data to create longitudinal bar graphs.Students answer questions about their graphs.Grade 2 » Measurement & Data CCSS.Math.Content.2.MD.
Subjects:
Grades:
K - 3rd
Types:
Also included in: 7 Tally Marks Tables & Longitudinal Bar Graphs BUNDLE
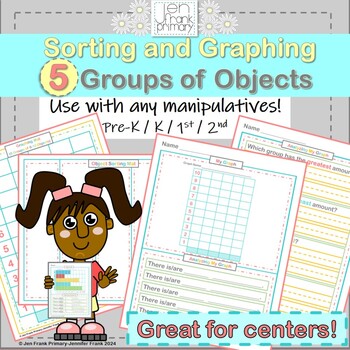
Sorting and Graphing 5 Groups of Objects/ Use with any manipulatives!
Sorting and Graphing 5 Groups of Objects/ Use with any manipulatives!A versatile activity for sorting, graphing, and analyzing data.Any small manipulatives can be used!For: Pre-K / K / 1st / 2ndWhat's Included?How to Play directions/ Photo ExamplesSorting Mat- a mat for sorting 5 groups of objects.Data Mat- a mat for representing each type of object and the corresponding number amount.Number Bin- a mat for organizing and storing the number cards. Two types-One for 0-5 objects, and one for 0-10 o
Grades:
PreK - 2nd
Types:
Showing 1-24 of 98 results


