257 results
Kindergarten graphing interactive whiteboards under $5
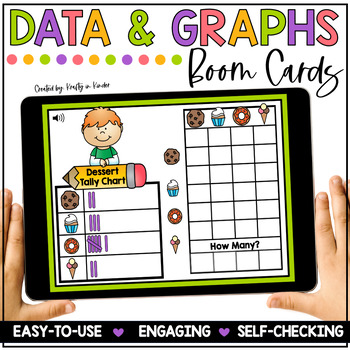
Data and Graphing Boom Cards for Kindergarten and First Grade Math Activities
Are you looking for Data & Graphing Activities for your Kindergarten or First Grade students? Your students will practice representing and analyzing data with this deck of Math Boom Cards. In this set of interactive digital task cards, students will look at the data collection or tally chart. Then, they will represent the data by dragging the pieces to create a picture graph. Lastly, they will analyze the data by counting and typing how many of each item.⭐️ Click HERE to SAVE with the Data a
Subjects:
Grades:
K - 1st
Types:
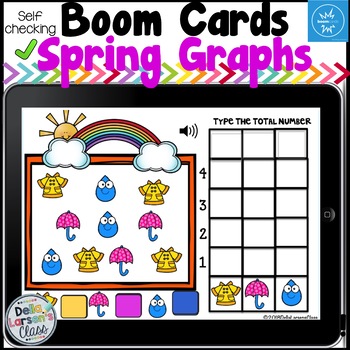
Boom Cards Spring Graph Distance Learning
Spring math NO PREP BOOM deck is filled with self checking slides to help your students with using data. This decks offer a fun way for your students classify objects into given categories; count the numbers of objects in each category, and compare which caegory has more. Bring digital activities into your math centers. Boom cards are self checking. Bonus Boom collects the data for you so it's a perfect addition to your RTI groups.⭐⭐⭐This is part of a $$$$ SAVING BUNDLE⭐⭐⭐ Boom CardsBoom Card
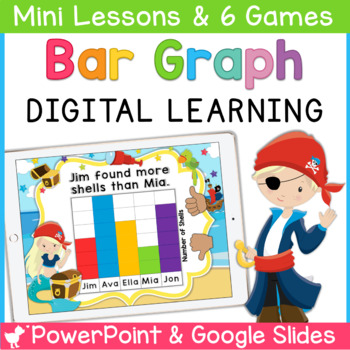
Bar Graph Digital Centers and Games | Google Slides | PowerPoint
Engage your students in learning how to read and analyze data on a bar graph using this PowerPoint and Google Slides bundle. This no prep digital math game includes 6 graphing centers with over 50 digital slides. Each interactive graphing game is self-checking and provides instant feedback! Adding this fun resource to your whole group or digital centers is easy as everything is preloaded into Google Slides and PowerPoint.Digital Bar Graph Centers - PowerPoint and Google SlidesGame 1 - Click to R
Grades:
K - 2nd
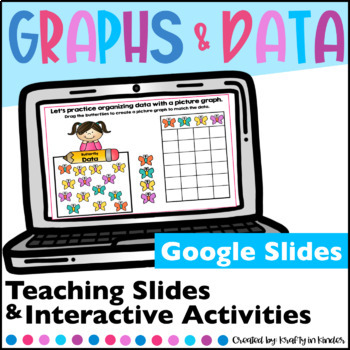
Data and Graphing Google Slides Graphing and Analyzing Data Math Lesson
This Google Slides resource is a hands-on and interactive way to introduce and review Graphing and Analyzing Data with your students! This focuses on tally charts and picture graphs and works great for distance learning or in the classroom! This Google Classroom resource includes teaching slides (Google Slides) as well as interactive activities with movable pieces so you can provide the most hands-on and engaging experience a digital resource can provide. This resource includes 23 Google Slides:
Grades:
K - 1st
Types:
CCSS:
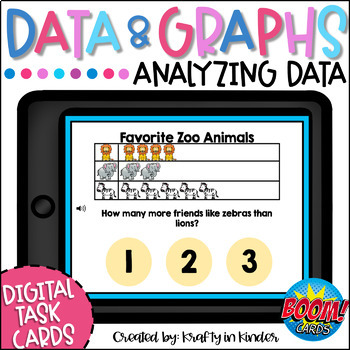
Graphing and Analyzing Data Boom Cards
Your students can practice analyzing data with this deck of Boom Cards. With these digital task cards, students will use the picture graphs and tally charts to answer questions about the data.This deck includes SOUND. Students will be able to click on a speaker to hear the directions and questions. Analyzing the data questions include topics such as least/most, how many, how many more, how many fewer and how many altogether.Topics addressed in this deck:Analyzing DataPicture GraphsTally ChartsBo
Subjects:
Grades:
K - 1st
Types:
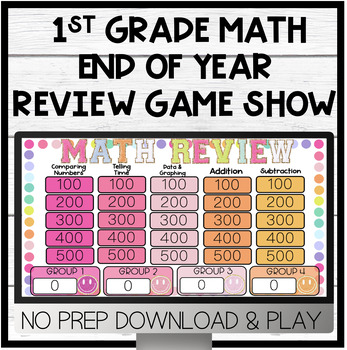
1st Grade Math End of Year Review | Game Show | Test Prep | NO PREP
Looking for a FUN and ENGAGING way to review key first grade math skills? Look no farther! My students BEG to play these Jeopardy style games and get so excited to compete against their classmates! Your students will love it too and get an extensive review of essential math skills! HOW IT WORKSOnce you open the product...You must hit "Enable Macros" to activate the scoring portion of the game!To put the slideshow in game mode you must click on the "Slide Show" tab and then press "Play from Start
Subjects:
Grades:
K - 2nd
Also included in: 1st Grade Phonics & Math Review Jeopardy Game BUNDLE
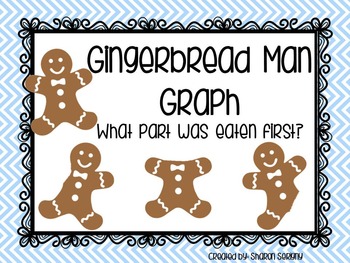
Gingerbread Man Graph
What part was eaten first? Looking for a great activity to do after reading "The Gingerbread Man"? Your students will love making and discussing this ActivBoard graph. Hunt for or give each student a gingerbread cookie and have them take one bite. Then graph what part they ate first. After the graph is completed discuss the results. You can then print the graph and display it in the class or in a graph collection in the class library. The kids love to revisit their graphs and read them.
Font
Subjects:
Grades:
PreK - 1st
Types:
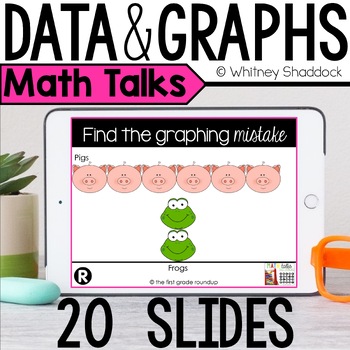
Graphing Math Talks Printable and Digital
First graders make sense of their math world and numbers by talking about it! These printable and digital graphing math talks give your kids ways to talk purposefully about the graphs and data standards for K-2.Get your students comfortable with analyzing and interpreting data with premade graphs, building graphs and data displays from scratch, and finding mistakes in data displays based on good attributes of data displays.Visit my blog for ideas on how I used graphing math talks in my classroom
Subjects:
Grades:
K - 2nd
Also included in: Number Talks Printable and Digital BUNDLE for Kindergarten to 2nd Grade
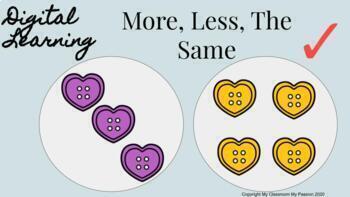
Counting and Comparing Quantity In Kindergarten: More, Less, The Same. Digital.
Young learners will use counting and quantity principles to consolidate concepts of "more, less and the same" when referring to groups of objects. They will easily click and drag the check mark to the correct group. This digital file can be used within the classroom on an interactive whiteboard/smart board, or on your virtual learning platform.
Grades:
PreK - 1st
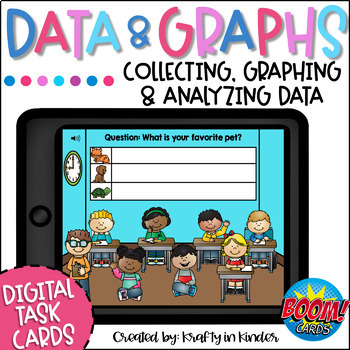
Data and Graphs Boom Cards
Your students can practice collecting, representing and analyzing data DIGITALLY with this deck of Boom Cards. In these interactive task cards, students will "survey" students, collect the data from the survey and answer questions about the data.Click HERE to SAVE 20% with the Data and Graphing BUNDLE!First, students will read or listen to the question. Then they will click on each student to hear their response to the question. As they hear their responses, they will drag the pictures to create
Subjects:
Grades:
K - 1st
Types:
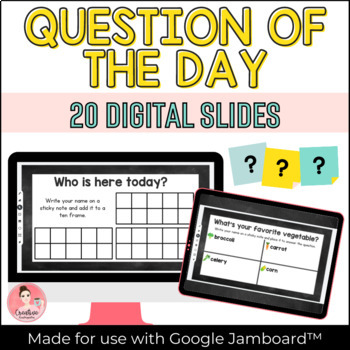
Question of the Day Interactive Activity with Google Jamboard™
Try this no prep question of the day interactive activity slides that are perfect for a whole group or small group discussions with your students. Display them on the computer or projector to build community and engagement. These 20 slides are perfect for in-person or virtual learning.InstructionsShare the Jamboard with your students or project it in your classroom. Students can add their own sticky note to the Jam, or you can add one for them. Changes can be seen in real time as students answer
Subjects:
Grades:
PreK - 2nd
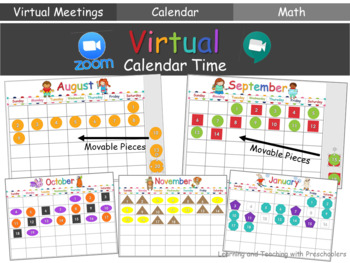
Virtual Calendar Time for Distance Learning
Virtual Calendar Time is a way to get the children singing and talking about numbers, shapes, colors and patterns during a daily instructional Zoom or Google Meeting. Do you like to have daily conversations about the weather? You can track the monthly weather too.You can also use the calendars and weather graphing chart in your classroom on any smart board; all you need is PowerPoint.You might also like:Learning Our Letters A to Z Bundle***********************************************************
Grades:
PreK - 1st
Types:
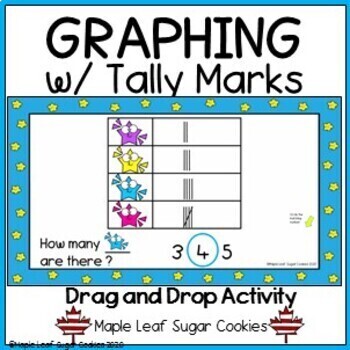
Graphing w/ Tally Marks - Data Management Graphs - Google Slides
Teach graphing and tally marks with this colourful and fun activity. Follow the prompts on each page to identify the number of items in the graphs. Children can drag the circles to the corresponding numbers in order to demonstrate knowledge of counting up tally marks in a graph. Interactive way to teach math skills. Great for interactive whiteboards, whole class lessons, math centres, assessment and Google Classroom.Newly revised: The final few slides have a "Match the Number to the Tally Mark"
Winter Graphing | Digital Math
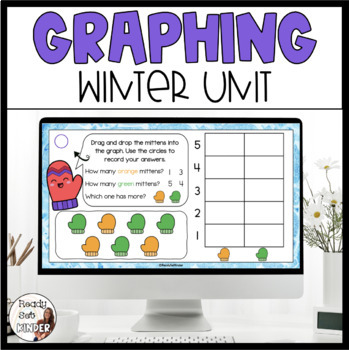
This digital resource has all you need for your graphing unit. These interactive slides are great for in person or virtual learning. Introduction and rules to graphing help to set the stage for students to collect and record data. Various types of graphs are included such as bar and pictographs, in horizontal and vertical forms. An asynchronous activity is included with printable blank bar graphs to assign in class, as a take home, or virtually. Winter graphing is made easy with these slides - j
Grades:
PreK - 1st
Go Math 1st Chapter 10.2 Represent and Interpret Data | Pictographs |BOOM CARDS
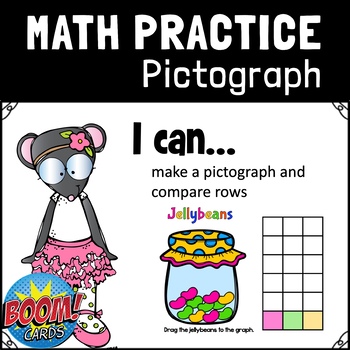
Students drag the jellybeans to the graph and answer questions about the totalnumber displayed on the pictograph. How many in each category How many more or less in one category than anotherGO MATH CHAPTER 10.2 Represent Data: PictographThis product was created as a companion to the GoMath Curriculum. This resource is an UNOFFICIAL companion and is NOT endorsed by Houghton Mifflin. Also works with other 1st Grade Math Curriculum!COMMON CORE STANDARD CC.1.MD.4Organize, represent, and interpret d
Grades:
PreK - 1st
CCSS:
Also included in: Math 1st | Chapters 7-12 | BOOM CARDS | Distance Learning Bundle
Go Math 1st Tally Charts | Interpret Data | BOOM CARDS
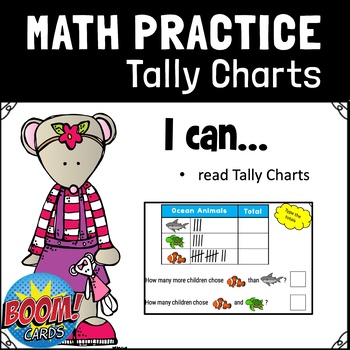
Students use the tally charts to answer questions about the data. 1. How many in identified categories 2. How many more in one category than another 3. How many in the 2 identified categories GO MATH CHAPTER 10.5 Interpret Data- Tally ChartsThis product was created as a companion to the GoMath Curriculum. This resource is an UNOFFICIAL companion and is NOT endorsed by Houghton Mifflin. Also works with other 1st Grade Math Curriculum!Animal themeCOMMON CORE STANDARD CC.1.MD.4 Organize, represent,
Grades:
K - 1st
CCSS:
Also included in: Math 1st | Chapters 7-12 | BOOM CARDS | Distance Learning Bundle
Addition and Subtraction Word Problems Google Slides PowerPoint Math Game
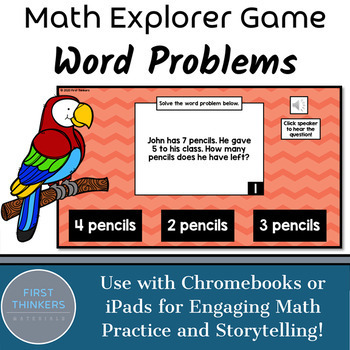
These word problem math activities are a great way to introduce engaging interactive practice to both your math centers and whole group through Google Classroom or Seesaw. Math Explorer enhances both student motivation and engagement by giving students a choice on where to start first and differentiating content. Ultimately, this game will help your students gain mastery in a myriad of concepts!⭐Included in a BUNDLE with over 30 concepts! CLICK HERE!⭐WHY USE THIS GOOGLE SLIDES AND POWERPOINT RES
Grades:
K - 2nd
Types:
Also included in: BUNDLE Full Year Math Games Google Slides PowerPoint Digital Interactive
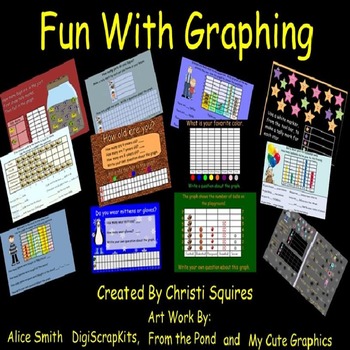
Fun With Graphing - SMARTBoard Lessons
Fun With Graphing works on the following Common Core Standard for First Grade:
Organize, represent, and interpret data with up to three categories; ask and answer questions about the total number of data points, how many in each category, and how many more or less are in one category than in another.
The students love going to the SMARTBoard to put their information on each graph.
I also have student take out their small whiteboards to write questions about the graphs. When everyone is d
Subjects:
Grades:
K - 2nd
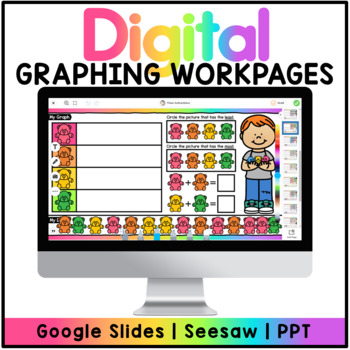
Digital Graphs - Google Slides™ | SeeSaw™ | PowerPoint
20 Interactive slides will allow students to practice creating and analyzing simple graphs.Includes:*PDF Link to Download Google Slides (20 Digital Task Cards)*PDF Link to Download Preloaded SeeSaw Cards (20 Digital Task Cards)*Interactive PowerPointSee video preview!Questions? Comments? Suggestions? Reach me at:TheBilingualTeacherCorner@gmail.comFollow My TPT StoreFollow Me on Instagram!Digital Graphing, Graphs, Kindergarten Math, Digital Math Activities, Digital Math Centers, Digital Math Work
Grades:
PreK - 1st
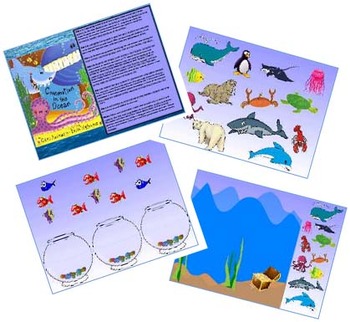
Commotion in the Ocean Supplemental Activities
This is an ocean themed Promethean board activity. It includes 7 slides and directions for each slide. It is full of great activities that can be paired with the book Commotion in the Ocean. This activity targets identification and labeling of ocean animals, categorization (color, size, habitat), graphing, qualitative concepts (more, most, least, same, none), following directions, and spatial concepts. My students love these interactive activities, I hope your students do too.**Please make sur
Subjects:
Grades:
PreK - 1st
Types:
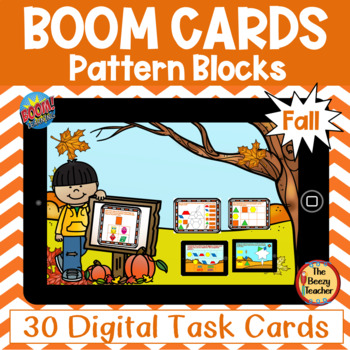
Fall Pattern Blocks BOOM Cards - Digital Task Cards
Your students will love playing with pattern blocks with a falltastic fall theme. These digital BOOM Cards offer a way to enhance math skills. Inspire an interest in math with activities such as matching shapes to pattern blocks and completing a puzzle to create familiar fall objects.These 30 digital task cards on the BOOM Learning website include: matching pattern blocks to 2D shapes, forming fall objects using pattern blocks and counting how many blocks used, completing and labeling patterns,
Grades:
K - 2nd
Names Activities with the Promethean Board
This activity includes ways to introduce the children's name in your class and have them learning at the same time. This activboard correlates to my name unit also available for sale on TpT.
Also visit my blog for more great ideas and freebies. www.littlepriorities.blogspot.com
Subjects:
Grades:
PreK - 2nd
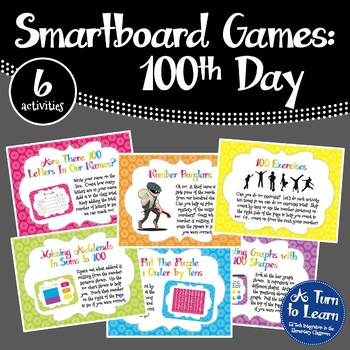
100th Day Smartboard Games - 6 activities (Smartboard/Promethean Board)
These six smartboard games are a great way to celebrate the 100th day of school. Each of these smartboard games incorporates a different math skill, and they are perfect to celebrate the 100th day with Kindergarten or 1st Grade students! These activities involve no prep work for the teacher and most activities are self checking: perfect for a whole class activity or for centers!
WHAT ACTIVITIES ARE INCLUDED IN THIS FILE?
This following activities are included:
• Are There 100 Letters In Our
Subjects:
Grades:
K - 2nd
Types:
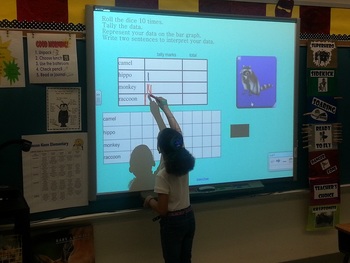
Bar Graph Smartboard Center Activity
These interactive slides are designed to effectively integrate technology into your classroom and provide students with an independent or collaborative math center activity creating bar graphs.
They will organize/collect data by rolling the picture dice.
They will represent their data by filling in a bar graph.
They will interpret their data by writing 2 sentences comparing the information on the bar graph.
Students love this bar graphing center!
Showing 1-24 of 257 results


