541 results
Common Core 7.SP.B.3 resources under $5
⭐7th Grade Math End of Year Escape Room Review⭐
PDF AND GOOGLE FORM INCLUDEDThis is a great way for students to work together and review their knowledge of all the skills learned in 7th Grade Math or great to use at the beginning of 8th Grade!There are a total of 5 tasks/puzzles included, one for each CCSS domain. TWO google forms links are included - one to use if you do not have google classroom and one if you would like to copy the form over into your own google drive. If you would rather use the digital version all you have to do is print
Subjects:
Grades:
7th
Also included in: 7th Grade Math Ultimate Curriculum and Activities Bundle
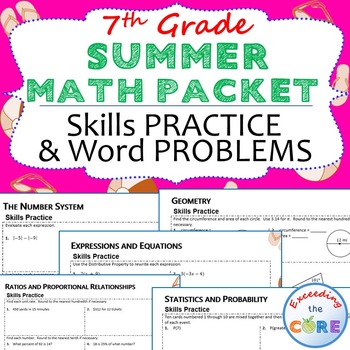
7th Grade SUMMER / June - July MATH PACKET - {Review/Assessments of Standards}
This 7th Grade SUMMER Math Packet has it all and requires NO PREP! The resources in this packet are designed to meet the state standards for 7th grade math.What is Included:I have included questions from each of the 7th grade domains, and each domain(topic) is on a different page so that you may customize this packet as needed. These questions are aligned to the 7th grade learning standards, making this the perfect resource for fluency and problem solving.Topics Include* page 2 - The Number Syst
Subjects:
Grades:
6th - 8th
Types:
Also included in: 7th GRADE MATH Assessments, Warm-Ups, Task Cards, Worksheets BUNDLE
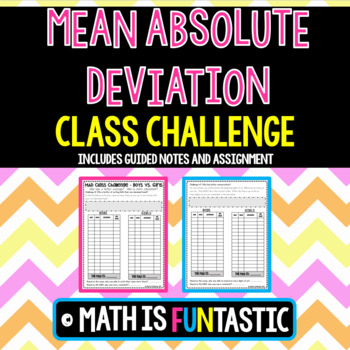
Mean Absolute Deviation - Class Challenge
Are you looking for an engaging way to teach Mean Absolute Deviation? Look no further! My students love completing this lesson.
This product is designed to help your students master the MAD in three easy steps.
1) Guided Notes – The guided notes contain an introduction to calculating MAD. Students will write the overall meaning of the MAD and the steps to calculating. There is an example problem for the teacher to model and then two “you try” problems for students to try independently a
Subjects:
Grades:
6th - 9th
Types:
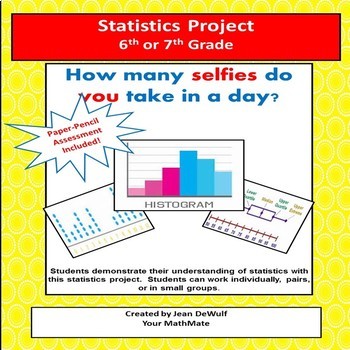
Statistics Project for 6th or 7th Grade! Bonus Assessment Included.
Your students are going to LOVE this interactive Statistics Project!You can choose either paper/pencil or digital formats for this project.Students can work individually, in pairs or in small groups.There are 5 parts to this project: Part I: Creating a Statistical Question Part II: Collecting Data & Determining the Measures of Center, Variation & 5 number summary. Part III: Creating 3 Graphs; a histogram, a dot plot and a box-n-whisker plot. Part IV: Written Description. Students will an
Subjects:
Grades:
6th - 7th
Types:
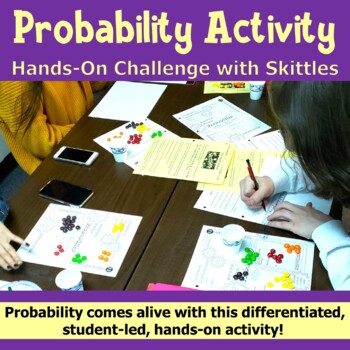
Probability Activity - Hands-On Challenge with Skittles - PBL with Math
Probability comes alive with this differentiated, student-led activity! The Skittles Probability Challenge provides practice using simple and compound probabilities in both theoretical and experimental fashion. Each student is given random data to work with. No two samples are identical. Students will: Make predictions based on logic.Determine the sample size of their personal data.Create a simple or two-way table to organize their data.Construct a graph or box & whisker plot to display the
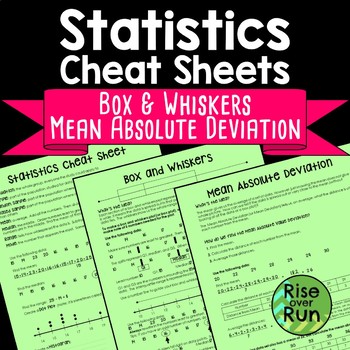
Box and Whiskers and Mean Absolute Deviation Cheat Sheets
Help students understand statistics vocabulary, dot plots, histograms, and box and whiskers diagrams, and mean absolute deviation with this resource.The three-page handout comes in two formats:Reference “Cheat Sheet” with all information filled in (pages 2-4)Guided Notes format with fill-in blanks and practice problems (pages 5-7)The first sheet defines important terms and helps students understand dot plots (or line plots) and histograms. The second sheet guides students in creating a box and w
Subjects:
Grades:
6th - 9th
Types:
CCSS:
Also included in: 7th Grade Math Activities, Lessons, Projects & More Bundle
⭐NO PREP Statistics & Probability Escape Room {7th Grade Math}⭐
PDF AND GOOGLE FORM CODE INCLUDED. It is a great way for students to work together and review their knowledge of statistics & probability. There are a total of 4 tasks/puzzles included as well as a Google Form Code if you want to do the whole thing digitally with no paper. If you would rather use paper all you have to do is print and you are ready to go, no prep needed! All of the tasks/puzzles are included in a PDF for quick printing.Topics Covered:- Statistics & Probability Vocabulary-
Subjects:
Grades:
7th
Types:
Also included in: 7th Grade Math Escape Rooms Bundle ★ Digital and Printable
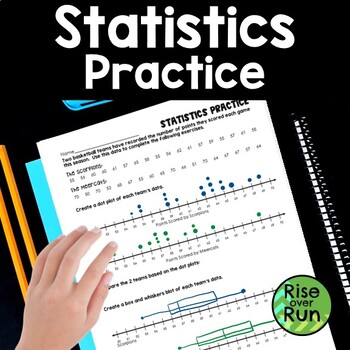
Box and Whiskers and Dot Plot Practice
Practice creating dot plots and box & whiskers plots with this statistics activity.Students are given scores for 2 basketball teams. They use the data to create a dot plot (or line plot) for each team and then a box and whiskers diagram for each team.Then, they compare the data of the teams.A bonus question asks students to calculate the mean absolute deviation.This worksheet can lead to great discussions about how to analyze box and whisker diagrams and make comparisons!
Subjects:
Grades:
6th - 7th
Types:
CCSS:
Also included in: Algebra 1 and 8th Grade Math Curriculum Bundle for Entire Year
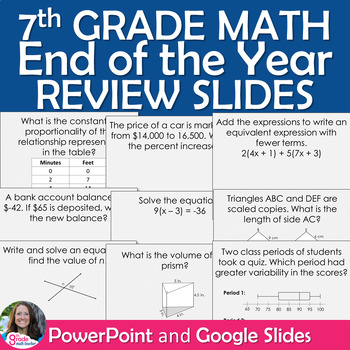
7th Grade Math End of the Year Review EDITABLE Slides
Help your students review 7th grade math with these 50 questions! This set of slides is fully editable using PowerPoint or Google Slides* and contains questions from throughout the entire school year. Each slide contains 1 question and can be printed on regular paper.Download the preview to see examples of the slides.Whether you are reviewing for the state test or an end of the year final, these slides are all you need! An answer key is included to make it easy to use! You can use this resource
Subjects:
Grades:
7th
Also included in: 7th and 8th Grade Math End of the Year Review PowerPoint Slides
(7th Grade) Mock Georgia Milestones (GSE) Math Practice Test Bundle
This test was designed to meet the rigor and format associated with the new Georgia Milestones Assessment. Students will get to review vital 7th Grade Georgia Standards of Excellence and also practice the "feel" and "format" of the Georgia Milestones before hand. What better way than to eliminate the pressure of a new testing format than to take a mock test adapted from the state provided documents. The state answer documents were modified to allow for a complete mock test or for testing individ
Subjects:
Grades:
7th
Types:
Math Escape Room Probability and Statistics | Digital and Print
Do you love using Escape Room activities, but hate the prep? Or are you looking to implement an Escape Room for the first time, but aren’t sure where to start? Then look no further, this resource is low prep, highly engaging, and so easy to implement (even if it’s your first time). This escape includes a tech-free and technology version and requires no lockboxes or elaborate setups! Essentially, students will work through 5 levels of rigorous questions and along the way gather a 5-digit to unloc
Subjects:
Grades:
7th
Types:
Also included in: Math Escape Room Bundle | Digital and Print | 7th Grade
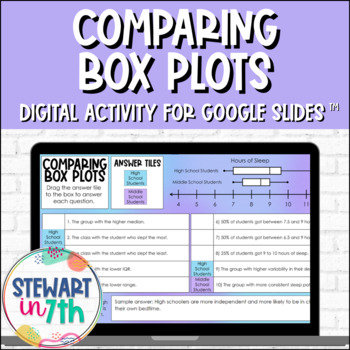
Comparing Box Plots Digital Activity
Students will use box and whisker plots to compare two populations in this fully digital resource. Two sets with 11 questions each are included: 10 drag and drop, 1 free response - 22 questions total. Intended for Google Classroom and Google Slides, this is great for distance learning or virtual teaching. Microsoft Teams users can download this resource from their Google account as a PowerPoint.******************************************************************************************************
Subjects:
Grades:
6th - 8th
Types:
Also included in: 7th Grade Statistics Digital Activity Bundle
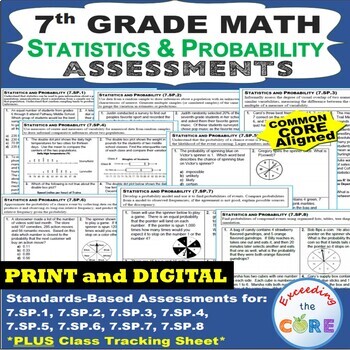
7th Grade STATISTICS & PROBABILITY Assessments (7SP) Common Core PRINT & DIGITAL
Assess your students' understanding of the 7th Grade STATISTICS & PROBABILITY (7.SP) Common Core.What is included:► a 1-page quick assessment for EVERY standard in the STATISTICS & PROBABILITY domain for 7th grade► a CLASS TRACKING SHEET to look at all of your students progress at a glancePrint and Digital (updated September 2020)✔️ PRINT VERSION - a PDF file that you may PRINT✔️ DIGITAL VERSION - made with Google Slides. Students type their answers directly on the slides in the provide
Subjects:
Grades:
6th - 8th
Types:
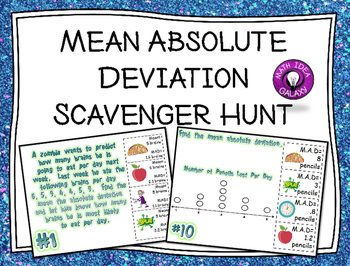
Mean Absolute Deviation Scavenger Hunt Activity
Go on a mathematical scavenger hunt to solve problems and get more practice with mean absolute deviation. The Mean Absolute Deviation Scavenger Hunt is an activity for practicing calculating the mean, absolute value, and mean absolute deviation using spot plots and story problems. This resource can used as partner work, a game, a small group activity, for fast finishers, or for a whole class activity.This resource includes: -12 problems-Answer Key-Student work pageSupports 7th Grade CCSS 7.SP.B
Subjects:
Grades:
6th - 7th
Types:
CCSS:
Also included in: 7th Grade Statistics and Probability Activity Bundle
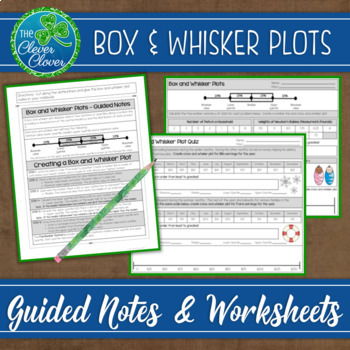
Box and Whisker Plots: Notes, Worksheets and an Assessment
This resource includes detailed step by step notes on how to create a box and whisker plot, a worksheet and an assessment.
The notes include step by step instructions that can be referenced as students study box plots. Students can glue the notes directly into their notebooks. A box and whisker plot visual is used to display the four quartiles of data. As students complete each step, they will determine the five-number summary used to create a box and whisker plot. The guided notes address
Subjects:
Grades:
6th - 9th
Also included in: Statistics Bundle - Guided Notes, Worksheets & Scavenger Hunts!
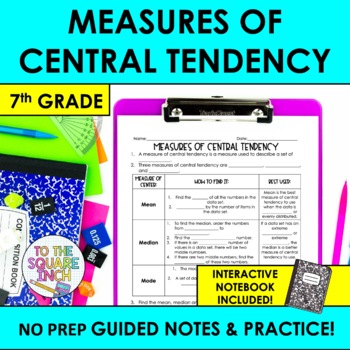
Measures of Central Tendency Notes & Practice | + Interactive Notebook Format
Searching for an effective way to teach your students measures of central tendency? These NO PREP guided notes are a classroom proven resource that will save you time and have your students proficient in measures of central tendency in no time! With a comprehensive design, these notes offer a structured approach that can be differentiated for every level of learner. Guided notes are an effective teaching model that maximize your students ability to use working memory to focus on content, rather
Subjects:
Grades:
6th - 8th
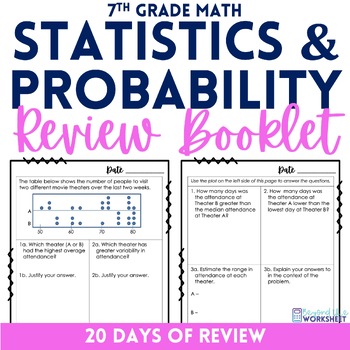
Statistics and Probability Review Booklet for 7th Grade Math
⭐️⭐️⭐️ This 7th grade math resource was designed to provide students with 20 days of practice with Statistics and Probability Standards.⭐️⭐️⭐️ Use as warm ups and bell ringers, exit tickets, stations or homework! Copy front to back for students to use as a booklet. This booklet provides an easy way for students to keep track of the skills they’ve learned and be able to look back and review before testing. Each day includes 4 problems, for a total of 80!❤️ CCSS Standards posters are included for
Subjects:
Grades:
7th
Types:
Also included in: 7th Grade Math Curriculum Supplemental Activities Bundle
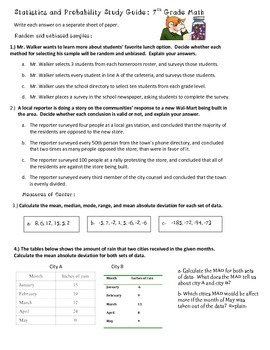
7th Grade Math Statistics and Probability Study Guide or Review
4 page study guide containing over 60 questions aligned to 7th grade SP common core standards. All questions are open-ended. Answer key is provided.
Covers the following topics:
~ Random and unbiased samples
~ Using data from a sample to make predictions about a population
~ Measures of central tendency
~ Range and mean absolute deviation
~ Box-and-whisker plots
~ The likeliness of an even occurring
~ Simple and compound probability
~ Independent and dependent events
~ Probability trees
This
Subjects:
Grades:
6th - 7th
Common Core Assessments Math - 7th - Seventh Grade - Statistics Probability 7.SP
Your Choice!!! Formal Assessment, Worksheets, or Task Cards
Questions are aligned precisely to the common core math standard. Each page contains at least 4 questions for each of the 8 common core math standards in THREE different formats.
This assessment is a SUBSET of my
Common Core Assessments / Warm Ups - Entire 7th Grade
Common Core Math 7th Assessments - Warm Ups - Task Cards - Seventh Grade
7.SP Statistics and Probability
Your Choice!!! Formal Assessment, Worksheets, or Task Ca
Subjects:
Grades:
6th - 8th
Types:
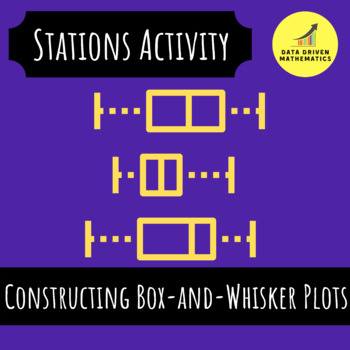
Constructing Box-and-Whisker Plots - Stations Activity
About This Resource:In this activity students will practice constructing box-and-whisker plots when provided a data set. Students will need to calculate the five number summary (minimum, first quartile, median, third quartile, and maximum) in order to be successful on this activity. The prep required by the teacher consists of printing the stations cards, making a copy of the graphic organizer for each student, and setting the expectations and instructions with their students.Your students will
Subjects:
Grades:
6th - 12th
Types:
CCSS:
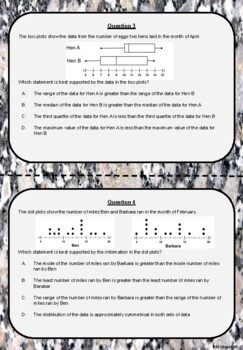
7.12A Math Comparing Dot Plots and Box Plots Task Cards
This is an 18 question task card activity that focuses on comparing dot plots and box plots. This activity aligns 100% to questions that are on STAAR Math 7th grade. I hope you like my product!!Be sure to check out my FULL lesson plan for teaching 7.12A!! This includes these task cards, a pixel art activity, and much much more!!
Subjects:
Grades:
7th
Types:
Quartiles, Interquartile Range (IQR), & Outliers
Straightforward sixth grade materials on quartiles, interquartile range (IQR), and the outlier calculation are very hard to find. I wrote these student pages to introduce these concepts in my statistics unit. The only prerequisite is how to find the median of a set of data.
Subjects:
Grades:
6th - 7th
Types:
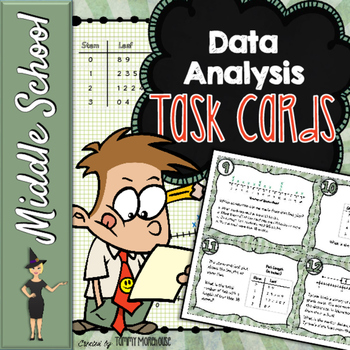
Data Analysis Task Cards
Data Analysis Task Cards
This is a set of 24 task cards covering multiple representations of data analysis including stem-and-leaf plots, box-and-whisker plots, line plots, and measures of central tendency. The questions are differentiated for a wide range of learners. These cards would be great for bell ringers, math stations, test prep, review, or just for fun!
What you get:
➸ 24 color task cards
➸ 24 black and white task cards
➸ Student answer sheet
➸ Key
You can laminate these and use th
Subjects:
Grades:
5th - 9th
Types:
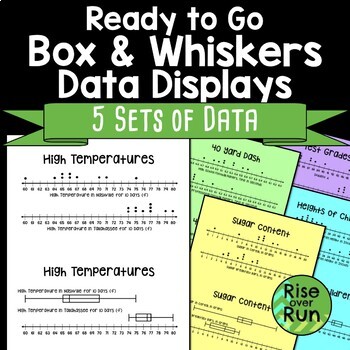
Box and Whiskers Plots Real World Examples
Practice comparing data shown in dot plots and box and whiskers diagrams with these 5 display sheets. Here's what's included:5 Data Display Sheets (Each sheet gives 2 sets of comparable data. The data is shown in dots plots and in box and whiskers plots.)Discussion Question IdeasI have had trouble finding large, neatly displayed data to use for statistics discussions and practice. That is why I created these sheets!Ideas for use:Stations: Use each sheet as a center. Each group of students stud
Subjects:
Grades:
6th - 7th
Types:
Also included in: Algebra 1 and 8th Grade Math Curriculum Bundle for Entire Year
Showing 1-24 of 541 results

