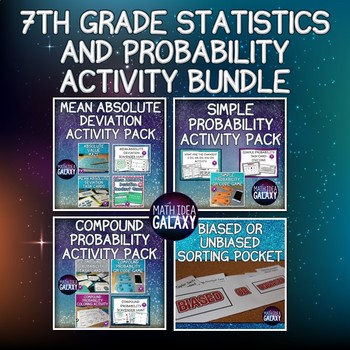
7th Grade Statistics and Probability Activity Bundle
Idea Galaxy
6.8k Followers
Grade Levels
7th
Subjects
Resource Type
Standards
CCSS7.SP.A.1
CCSS7.SP.B.3
CCSS7.SP.C.5
CCSS7.SP.C.6
CCSS7.SP.C.7
Formats Included
- Zip
Pages
Approx 150 pages
Idea Galaxy
6.8k Followers

Includes Google Apps™
This bundle contains one or more resources with Google apps (e.g. docs, slides, etc.).
Products in this Bundle (22)
showing 1-5 of 22 products
Description
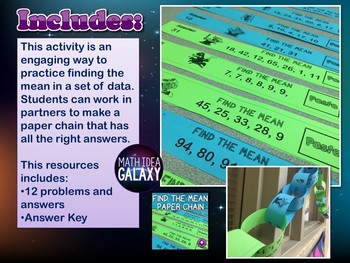
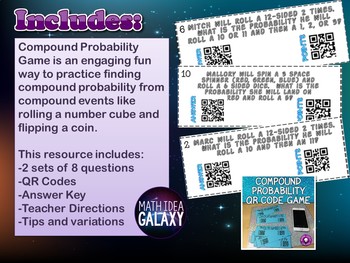
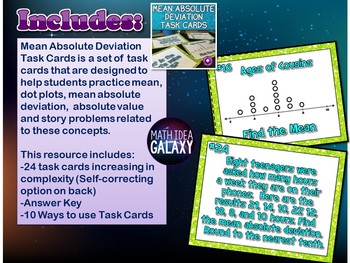
This is a collection of over 20 resources that help students to learn, practice, and review concepts related to statistics and probability for 7th grade. Students will be engaged with discovery labs, mazes, foldable graphic organizers, games, and more. They will explore mean absolute deviations, simple probability and compound probability.
Total Pages
Approx 150 pages
Answer Key
Included
Teaching Duration
2 Weeks
Report this resource to TPT
Reported resources will be reviewed by our team. Report this resource to let us know if this resource violates TPT’s content guidelines.
Standards
to see state-specific standards (only available in the US).
CCSS7.SP.A.1
Understand that statistics can be used to gain information about a population by examining a sample of the population; generalizations about a population from a sample are valid only if the sample is representative of that population. Understand that random sampling tends to produce representative samples and support valid inferences.
CCSS7.SP.B.3
Informally assess the degree of visual overlap of two numerical data distributions with similar variabilities, measuring the difference between the centers by expressing it as a multiple of a measure of variability. For example, the mean height of players on the basketball team is 10 cm greater than the mean height of players on the soccer team, about twice the variability (mean absolute deviation) on either team; on a dot plot, the separation between the two distributions of heights is noticeable.
CCSS7.SP.C.5
Understand that the probability of a chance event is a number between 0 and 1 that expresses the likelihood of the event occurring. Larger numbers indicate greater likelihood. A probability near 0 indicates an unlikely event, a probability around 1/2 indicates an event that is neither unlikely nor likely, and a probability near 1 indicates a likely event.
CCSS7.SP.C.6
Approximate the probability of a chance event by collecting data on the chance process that produces it and observing its long-run relative frequency, and predict the approximate relative frequency given the probability. For example, when rolling a number cube 600 times, predict that a 3 or 6 would be rolled roughly 200 times, but probably not exactly 200 times.
CCSS7.SP.C.7
Develop a probability model and use it to find probabilities of events. Compare probabilities from a model to observed frequencies; if the agreement is not good, explain possible sources of the discrepancy.


