
Math Escape Room Probability and Statistics | Digital and Print


- PDF
- Google Apps™

What educators are saying
Also included in
 Do you love using Escape Room activities, but hate the prep? Then look no further, this resource is low prep and highly engaging. It can be used with or without technology and requires no lockboxes or elaborate setups! Essentially, students will work through 5 levels of rigorous questions and alongPrice $23.00Original Price $28.50Save $5.50
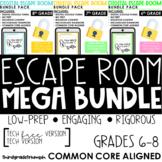 Do you love using Escape Room activities, but hate the prep? Or are you looking to implement an Escape Room for the first time, but aren’t sure where to start? Then look no further, this resource is low prep, highly engaging, and so easy to implement (even if it’s your first time). This escape incluPrice $62.00Original Price $84.50Save $22.50
Description
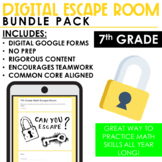
Do you love using Escape Room activities, but hate the prep? Or are you looking to implement an Escape Room for the first time, but aren’t sure where to start? Then look no further, this resource is low prep, highly engaging, and so easy to implement (even if it’s your first time). This escape includes a tech-free and technology version and requires no lockboxes or elaborate setups! Essentially, students will work through 5 levels of rigorous questions and along the way gather a 5-digit to unlock the next level. If you choose to use the tech version, they will type their codes into the Google Form, but if you are using the tech-free version, you would just have your students record their codes on their code collection sheet and check their code with your answer key. If they get it right, they can advance to the next level, but if they get it wrong, they must figure out which question(s) they got wrong in order to advance. Slow and steady wins the race!
After visiting the Ron Clark Academy (RCA), which if you haven't had the opportunity to do so, I highly suggest it! It's an AMAZING experience and really life-changing. I saw this concept used there, so I adapted it and changed it for my classroom. My students are always begging me to play this!
Includes a fully digital version, perfect for distance learning!
There are 5 levels of rigorous content they need to work through. In order to complete this escape room, students should be familiar with:
- Find the likelihood of events
- Make inferences for data
- Determine appropriate situations for random sampling
- Determine the probability of events (theoretical, experimental, compound, etc.)
- Aligned to 7.SP.1, 7.SP.2, 7.SP.3, 7.SP.4, 7.SP.5, 7.SP.6, 7.SP.7, and 7.SP.8
This is a great way to review the probability math content you've taught in 7th grade or a great way to review at the beginning of the year for 8th graders returning from summer vacation. Make the days leading up to your assessment fun with this rigorous and engaging math review.
>>>>>>>>>>>>>>>>>>>>>>>>>>>>>>>>>>>>>>>>>>>>>>>>>>>>>>>>>>>>>>>>>>>>>>>>>>>>
Let's connect and stay in touch for freebies, updates, and more!
