
6th Grade Statistics & Data Bundle - 6 Powerpoint Lessons - 402 Slides


- Zip
What educators are saying
Products in this Bundle (6)
showing 1-5 of 6 products
Bonus
Also included in
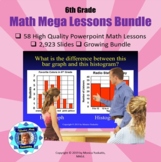 Sixth Grade Powerpoint Math Bundle is composed of 58 different high quality math powerpoint lessons comprising 2,923 slides. These are perfect for distance learning on Zoom or similar formats. On top of that they are powerful when used as direct instruction in the classroom.There are 22 strategiesPrice $149.63Original Price $213.75Save $64.12
Description
Sixth Grade Statistics and Data Bundle - It is composed of 6 different lessons comprising 402 slides on the following: Statistics and Data 1 - Statistical Questions and Types of Data, Statistics and Data 2 - Mean, Median, Mode & Range, Statistics and Data 3 - Dot Plot and Data Distribution, Statistics and Data 4 - Histogram, Statistics and Data 5 - Box and Whisker Plot, Statistics and Data 6 - Mean Absolute Deviation. For more information on these powerpoint lesson click on the individual lessons. There are 22 strategies of effective teaching based on research in each of these lessons. For best results, students should have white boards and dry erase markers. Included in these powerpoint lessons are the following:
- title slide
- focus slide
- objectives
- essential question
- concept development
- step-by-step demonstrations
- problem solving with word problem
- reward slide
Be sure to follow my store to be alerted of new products. The first 48 hours is always 50% off. CLICK HERE
Don't forget to leave feedback on this lesson to earn points for purchasing other TpT products.
You may be interested in the following powerpoint lesson bundles:
6th Grade Ratios and Proportions Bundle - Five Powerpoint Lessons -202 Slides
6th Grade Geometry Bundle - 8 Powerpoint Lessons - 407 Slides
