32 results
7th grade algebra simulation microsofts
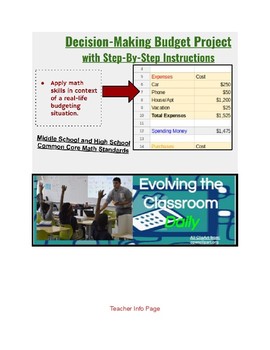
Budget Spreadsheet Project (personal finance & math skills)
A step-by-step project with detailed instructions on how to set up an Excel spreadsheet budget. Students will apply math skills in context of a real-life budgeting situation.
Students will create a budget:
-Based on their future career choice.
-Independently by following the instructions using an Excel Spreadsheet.
-Over the course of at least 2 class periods (typically students take at least 2.5 hours to complete this project).
Subjects:
Grades:
6th - 12th
Types:
CCSS:
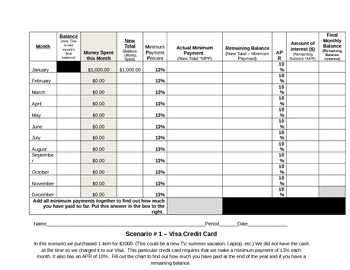
Percents: Understanding Credit Card Debt Worksheet for Student - Scenario 1
The question listed on Scenario 1 is as follows:
"In this scenario we purchased 1 item for $1000. (This could be a new TV, summer vacation, Laptop, etc.) We did not have the cash at the time so we charged it to our Visa. This particular credit card requires that we make a minimum payment of 13% each month. It also has an APR of 10%. Fill out the chart to find out how much you have paid at the end of the year and if you have a remaining balance. "
The chart is a great way for students to disc
Subjects:
Grades:
7th - 10th
Types:
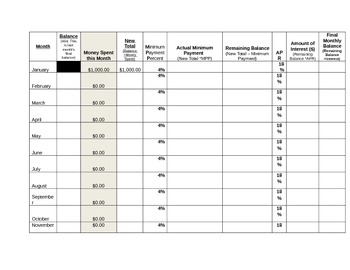
Real Life Math: Percents: Credit Card Debt Worksheet - Scenario # 2
The scenario on this chart is as follows:
"MasterCard sent you a fabulous new credit card offer in the mail. It is a special card for teens with really low minimum monthly payment percent of 4%. In exchange for the low minimum monthly payment percent, MasterCard raised your APR to 18%. You decide to use this credit card instead of the Visa in Scenario #1. Fill out the chart and determine the amount of money you spent and your remaining balance. "
The chart is a great way for students to di
Grades:
7th - 10th
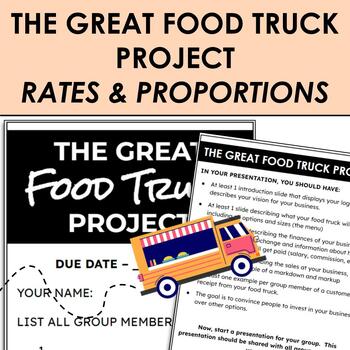
"The Great Food Truck Project" - Rate, Proportions, and Percents Unit Assessment
A rates and proportions unit project, centering around the real-world use of percentages and rates. Students work with a small group to create their own concept for a food truck, including what food and drink options they would sell. Using inspiration for "The Great Food Truck Race" and "Sharktank" TV shows, students work to create a best-selling idea, that also showcases their own values as a "company".I hope to share more information and examples of how I use this project with my upcoming ye
Subjects:
Grades:
6th - 8th
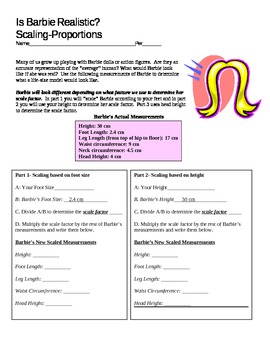
What would Barbie Look like if she were Real?
Ever wondered what Barbie would look like if she were real? Now you can work with your students to find out!
Part 3
In order to save you and your students time, I measured various segments of Barbie's actual doll measurements. Students can use their measurements from Parts 1 and 2 of the Human Body Proportion Lab (available on TCP) OR measure their height or foot size to determine the SCALE FACTOR between their body and the doll's body. Using the SF, students will determine Barbie's measure
Subjects:
Grades:
7th - 10th, Higher Education, Adult Education
Types:
Statistics Mode, Median, Mean, Range Worksheet for Math or Psychology
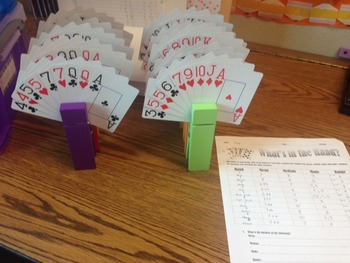
What's in the Hand: Activity makes learning mode, median, mean, and range fun. You will need two packs of playing cards in order to use 10 different variations. I use giant clothes pins to hold a total of 9 cards for each station. Each student gets a worksheet and is assigned to a group of 4-5 students. Students will complete the first rotation by figuring the mean, median, mode, and range, and then rotate to each other station in about 5 min intervals. At the end they will answer the questions
Subjects:
Grades:
5th - 12th
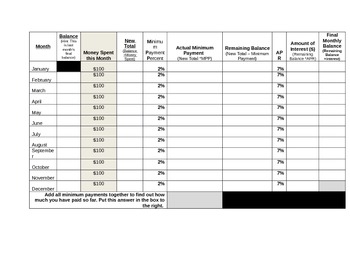
Percents: Understanding Credit Card Debt Worksheet for Students - Scenario 3
This chart covers the following scenario:
"Capital One offers a special credit card for teens. It has a spending limit of $100 per month and a very low monthly payment of 2%. The APR for this card is also pretty low at 7%. You talk to your parents and they agree that it sounds safe so they cosign the card with you. You now have your own credit card to use for monthly purchases and do not have to constantly ask your parents for money. You will owe your parents the remaining balance at the end
Grades:
7th - 10th
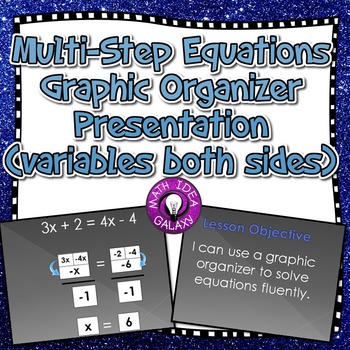
Solving Multi-Step Equations Interactive Lesson and Presentation
This interactive powerpoint presentation will get your students solving multi-step equations with ease, understanding the process of solving multi-step equations, and explaining multi-step equations to others. It is designed with special education students and other students who take more time to learn, in mind. When using this lesson and graphic organizer we went from about half of our students getting it, to about 95% of them being able to solve multi-step equations with ease.Supports 7th gr
Grades:
6th - 9th
Also included in: Solving Multi-Step Equations Partner Activities
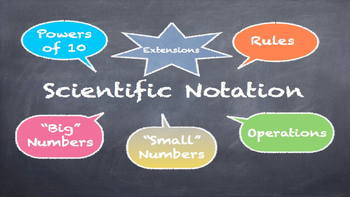
Word Problems with Scientific Notation
This PowerPoint is a detailed description, explanation, and animation on how to solve word problems involving Scientific Notation. It includes the following: an introduction, prior knowledge skills needed, direct instruction, independent study, and an list of key terms and phrases to help students solve problems. You will not have to write anything on the board. Every animation will be made by a click of a button. Your students will definitely be proficient upon completion!
Subjects:
Grades:
7th - 9th
CCSS:
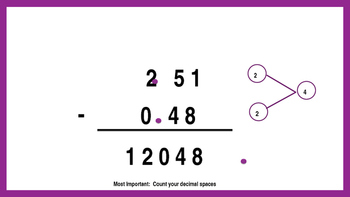
Multiplying and Dividing Scientific Notation
This PowerPoint is a detailed description, explanation, and animation on how to Multiply and Divide quantities written in Scientific Notation. It includes the following: an introduction, prior knowledge skills needed, direct instruction, independent study, and youtube videos for enrichment. You will not have to write anything on the board. Every animation will be made by a click of a button. Your students will definitely be proficient upon completion!
Subjects:
Grades:
7th - 9th
CCSS:

What would Barbie Look like if she were Real? Part 3 and 4 - Body Proportions
Ever wondered what Barbie would look like if she were real? Now you can work with your students to find out!
Part 3
In order to save you and your students time, I measured various segments of Barbie's actual doll measurements. Students can use their measurements from Parts 1 and 2 of the Human Body Proportion Lab (available on TCP) OR measure their height or foot size to determine the SCALE FACTOR between their body and the doll's body. Using the SF, students will determine Barbie's measure
Subjects:
Grades:
7th - 10th, Higher Education, Adult Education
Types:
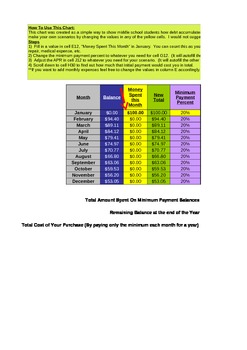
Why Paying the Minimum is Bad - Credit Card Debt Calculator - Percents
This Excel file is set up to show students how quickly debt can add up if they only pay the minimum balance on a credit card. The spreadsheet is already formatted to do the calculations for you! All you have to change is your initial credit card balance and change the APR and minimum payment balance to fit different scenarios. This is a quick way to show your students the "big picture" when it comes to credit card debt. It is also a nice way to introduce students to applications of percents
Subjects:
Grades:
7th - 10th
Types:
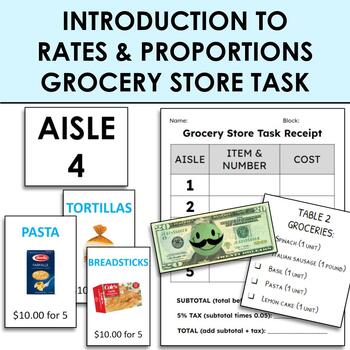
Introduction to Rates and Proportions - Grocery Store Task
This activity is designed to introduce students to the concept of rates and unit rates, through a simulation-style grocery store activity. With a small group, students are given a grocery list, a “$20 bill”, and open access to five “grocery store aisles”. Students will travel the aisles with their “families” while shopping for their dinner ingredients. They have only $20 to spend, so they must find how much only 1 unit of each item costs, as they do not want to overspend. Using their receipt
Subjects:
Grades:
6th - 8th
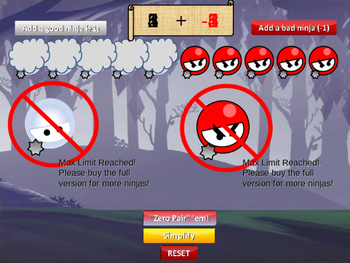
FREE VERSION - Additive Inverse & Zero Pair Ninjas for teaching Integers
Do you need an interactive, fun, and engaging way to teach integers, zero pairs, or additive inverses? This PowerPoint is your answer, and will allow students to visually see what is happening when you add integers. It uses "good" and "bad" ninjas to demonstrate concepts of additive inverse and zero pairs.
If your student is not understanding how to add or subtract integers, please give this a try. Your students will love it! Mine do!
This is the free version where you are limited to 10 ninjas
Subjects:
Grades:
6th - 10th
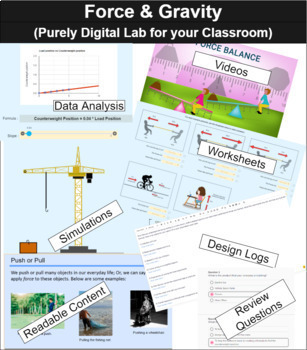
Force Balance - Understanding Force & Gravity :Purely Digital Lab for Classrooms
This ActiveLearningLabs Lab is a purely digital two-day (one hour per day) STEM lab in which students will engage in a real-life situation and master the concepts of Force and Gravity to solve a real-world problem.With a single license, you can run the lab for up to 5 classrooms. Before purchasing the lab, click on this link to run the lab for yourself without needing to create an account - https://activelearninglabs.com/lab-details/ed2b3bc5-f6d4-4a0c-a745-32fa29a2b6e9?source=tpt and click on "P
Subjects:
Grades:
6th - 8th
Types:
NGSS:
MS-ETS1-4
, MS-PS2-2
, MS-ETS1-1
, MS-ETS1-3
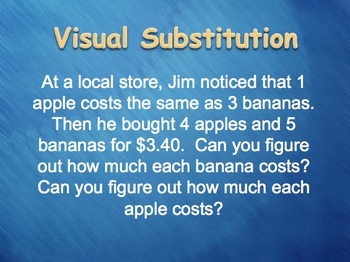
Visual Substitution for a System of Equations
This powerpoint uses pictures of apples and bananas to represent a real-world system of equations. Using click-by-click animation, students can see how one apple can be replaced with three bananas because they are of equal value. This series of slides then lays the ground work for students to move from pictorial equations to symbolic equations using number and variables.
Subjects:
Grades:
7th - 10th
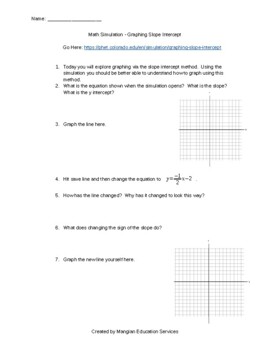
Virtual - Slope Intercept Learning Simulation
Using the simulation by phet, students can better understand how changing the slope and y intercept change their graphs.
Subjects:
Grades:
7th - 10th
Types:
Demonstrate Ordering Numbers with an Animated Excel File
Simple to use animated Excel file for in class demonstration of Ordering Numbers from whole numbers, integers, positive rational, rational, and real numbers. Self-correcting quiz format that automatically generates a new set of numbers. Move scroll bars, select option buttons, type numbers, and watch these mathematical concepts come alive. You must use Microsoft Excel that is capable of opening file formats in either .xlsx or .xlsm.
Subjects:
Grades:
4th - 12th
Types:
Demonstrate Absolute Value Equality in 2 Variables with an Animated Excel File
Simple to use animated Excel file for in class demonstration of solutions to absolute value equalities in 2 variables such as y=|x|, y=a|x|, y=a|x+b|, and y=a|x+b|+c. Move scroll bars, select option buttons, type numbers, and watch these mathematical concepts come alive. You must use Microsoft Excel that is capable of opening file formats in either .xlsx or .xlsm.
Grades:
7th - 12th
Types:
Demonstrate Absolute Value Equalities in 1 Variable with an Animated Excel File
Simple to use animated Excel file for in class demonstration of solutions to absolute value equalities in 1 variable such as |x|=d, |x-b|=d, a|x-b|=d, and a|x-b|+c=d. Move scroll bars, select option buttons, type numbers, and watch these mathematical concepts come alive. You must use Microsoft Excel that is capable of opening file formats in either .xlsx or .xlsm.
Grades:
7th - 12th
Types:
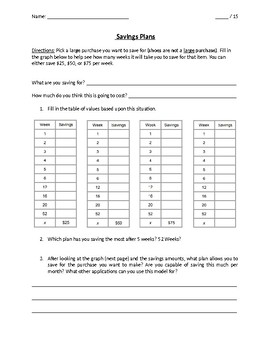
Personal Consumer Math Savings Plan
This activity helps students see the difference in saving different amounts of money at over similar time periods. Most students we talk with are very nearsighted when saving money, and this will help them see how fast savings add up over the course of several weeks to a year. It will also help students create goals in saving to help purchase a "big ticket item." Students have different tables to enter their weekly savings, and after they complete they will graph the savings on a unlabeled graph
Subjects:
Grades:
7th - 12th, Adult Education
Demonstrate One-Variable Equations in 2-Dimensions with an Animated Excel File
Simple to use animated Excel file for in class demonstration of One-Variable Equations in 2-Dimensions. Graph types include vertical (x=c), horizontal (y=c), and both types on one graph. Move scroll bars, select option buttons, type numbers, and watch these mathematical concepts come alive. You must use Microsoft Excel that is capable of opening file formats in either .xlsx or .xlsm.
Subjects:
Grades:
7th - 12th
Types:
Demonstrate Basic Statistics Plots with an Animated Excel File
Simple to use animated Excel file for in class demonstration of Basic Stem-n-Leaf plot, Box and Whisker plot, and Frequency plot. Move scroll bars, select option buttons, type numbers, and watch these mathematical concepts come alive. You must use Microsoft Excel that is capable of opening file formats in either .xlsx or .xlsm.
Grades:
6th - 12th
Types:
Demonstrate Compare Basic Statistical Graphs with an Animated Excel File
Simple to use animated Excel file for in class demonstration of comparing basic statistical graphs such as XY-scatter, Line, Column, Bar/Histogram, Area, and Pie, with the ability to select Ribbon, 3-d Column, 3-d Bar, 3-d Area, or 3-d Pie. Move scroll bars, select option buttons, type numbers, and watch these mathematical concepts come alive. You must use Microsoft Excel that is capable of opening file formats in either .xlsx or .xlsm.
Grades:
6th - 12th
Types:
Showing 1-24 of 32 results


