Demonstrate Compare Basic Statistical Graphs with an Animated Excel File
Stanley Matsuda
0 Followers
Description
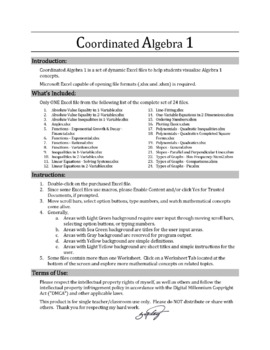
Simple to use animated Excel file for in class demonstration of comparing basic statistical graphs such as XY-scatter, Line, Column, Bar/Histogram, Area, and Pie, with the ability to select Ribbon, 3-d Column, 3-d Bar, 3-d Area, or 3-d Pie. Move scroll bars, select option buttons, type numbers, and watch these mathematical concepts come alive. You must use Microsoft Excel that is capable of opening file formats in either .xlsx or .xlsm.
Total Pages
Answer Key
N/A
Teaching Duration
N/A
Last updated Feb 17th, 2021
Report this resource to TPT
Reported resources will be reviewed by our team. Report this resource to let us know if this resource violates TPT’s content guidelines.


