6 results
Common Core 3.MD.B.3 research microsofts
6 Editable Bar Graph Templates 2.0
Finally a simple and professional graph space that students can fill out without any design issues getting in the way. This file contains 6 ready-to-use graph options. Print them and have students fill them with pencil and ruler, or distribute them over computer and let them practice entering the data. Get a project perfect finish every time. Maybe you just want to fill it out live on a projector? The possibilities are endless! It's okay to say you love these bar graphs. So do we.Contains:- 2 bl
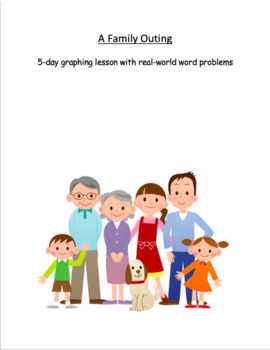
Real-world Word Problems with Graphing and Time: A Family Outing
There are 5 days worth of lessons using horizontal bar graphs, vertical bar graphs, and picture graphs. Each lesson uses the same flier with information of real places in Phoenix, Arizona to visit on a weekend. Students are to collect the data and answer the questions based on their personal family information. Students need to both collect data to create graphs and read them to answer questions.Each lesson also has a few word problems regarding time. Students need to identify what method of ope
Subjects:
Grades:
3rd - 4th
Types:
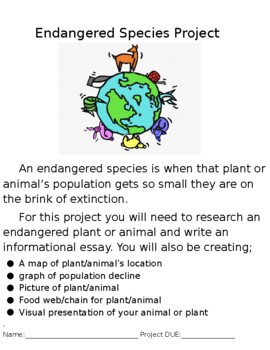
Endangered Species Project
This project encompasses writing about endangered animals. It conforms to NGSS standards as well as Common Core standards for ELA and Math (California). It contains a rubric, graphic organizer, and examples for students. This project can be edited to fit your classroom needs.

Explore the Planets with Gustav Holst
A great addition to your planet or Mars Rover study. Student teams will review the planets in our solar system while they listen to The Planets, a suite composed by Gustav Holst which will guide them to look at the planets in a new way. Afterward, they will research two planets or a burning “I Wonder” question. Teams will present findings with an infographic using canva.com, a free online resource for fliers, infographics, Instagram posts, newspapers, and so much more!This bundle includes the fo
Subjects:
Grades:
3rd - 5th
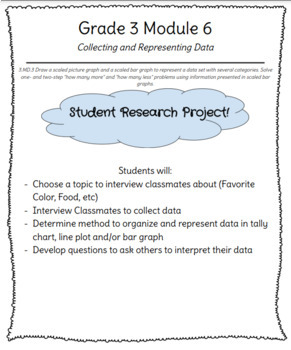
Grade 3 Module 6: Data Collection Research Project
Engage students in this hands on research activity to study data collection and representation!Students will have an opportunity to select their own research topic to collect data from classmates. Encourage community building by allowing students to interview one another to identify interesting facts about their classmates. In this activity, there are 3 data representation pages that students can choose from to showcase their findings; a tally chart, line plot or bar graph. Have them select one
Subjects:
Grades:
3rd
Types:
CCSS:
Using Data to Support a Hypothesis
In this math challenge, students must create a hypothesis and then collect and display data to support their hypothesis!
Showing 1-6 of 6 results

