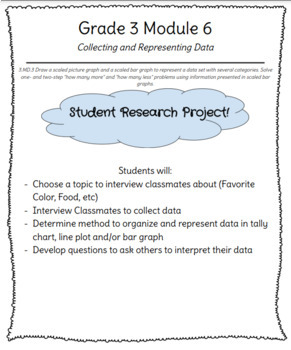
Grade 3 Module 6: Data Collection Research Project
Mrs Macchia
4 Followers
Grade Levels
3rd
Subjects
Resource Type
Standards
CCSS3.MD.B.3
Formats Included
- Google Docs™
Pages
5 pages
Mrs Macchia
4 Followers

Made for Google Drive™
This resource can be used by students on Google Drive or Google Classroom. To access this resource, you’ll need to allow TPT to add it to your Google Drive. See our FAQ and Privacy Policy for more information.
Description
Engage students in this hands on research activity to study data collection and representation!
Students will have an opportunity to select their own research topic to collect data from classmates. Encourage community building by allowing students to interview one another to identify interesting facts about their classmates.
In this activity, there are 3 data representation pages that students can choose from to showcase their findings; a tally chart, line plot or bar graph. Have them select one data chart or use all three!
Finally, students can create reflection questions to analyze and interpret their data findings.
This resource is the ultimate engagement tool to have students practice data collection and analysis in real time!
Total Pages
5 pages
Answer Key
N/A
Teaching Duration
N/A
Report this resource to TPT
Reported resources will be reviewed by our team. Report this resource to let us know if this resource violates TPT’s content guidelines.
Standards
to see state-specific standards (only available in the US).
CCSS3.MD.B.3
Draw a scaled picture graph and a scaled bar graph to represent a data set with several categories. Solve one- and two-step “how many more” and “how many less” problems using information presented in scaled bar graphs. For example, draw a bar graph in which each square in the bar graph might represent 5 pets.


