3 results
10th grade Women's History Month arithmetic laboratories
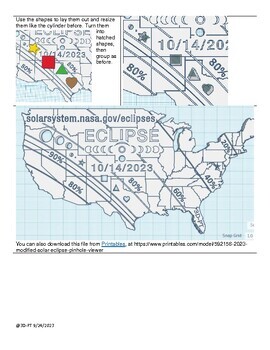
Shape the Eclipse Lab: Craft Your Pinhole Viewer with TinkerCAD!
On Oct.24, 2024 their will be an annular solar eclipse that will be viewable over the continental US! NASA released a 3D printable pinhole viewer for the USA. But they also released an activity to see if the size and shape of the pinhole affects the shape of the eclipse! In just a few steps, students can design and create their pinhole viewers, making this lab the ideal hands-on activity to witness this celestial event safely.Key Highlights: Solar Eclipse Ready: Prepare for the solar eclipse and
Grades:
6th - 12th, Higher Education, Adult Education
Types:
CCSS:
NGSS:
HS-ESS1-6
, HS-ESS1-4
, HS-ESS1-1
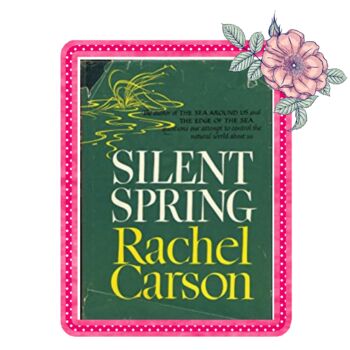
Silent Spring by Rachel Carson High school biology, chemistry, history lesson
The activities are designed as a ready-to-go lesson, easily implemented by a teacher or his/her substitute to supplement a unit of study. In chemistry, the activities relate to concentration, with units as small as parts per million; solubility of compounds in water versus fat; and decision-making based on green chemistry principles. In biology, the activities related to the effect of a contaminant on a food chain and bioaccumulation of a fat-soluble contaminant. In environmental science, the ac
Subjects:
Grades:
9th - 12th
Types:
NGSS:
HS-ESS3-3
, HS-ESS3-2
, HS-ESS3-4
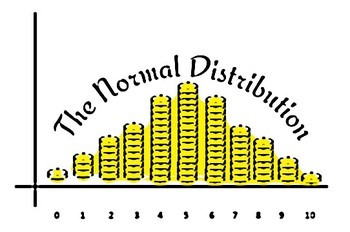
The Normal Distribution - Made Easy
This activity requires students to flip a coin 100 times, exchange data with other students, and create a frequency table based on the results. Students should be able to recognize the structure of a normal distribution curve and explain how the associated statistics � mean, median, mode, etc. � relate to the probability of flipping a coin. Students practice creating frequency tables, constructing histograms, and interpreting data. Teachers may use this activity
Subjects:
Grades:
7th - 12th
Types:
Showing 1-3 of 3 results


