24 results
Common Core 3.MD.B.3 centers for Microsoft Word
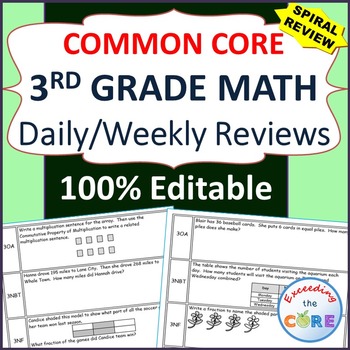
3rd Grade Daily or Weekly Spiral Math Review {Common Core} - 100% Editable
Need a SPIRAL REVIEW of the 3rd Grade Common Core standards?
What is included:
This resource contains 20 WEEKS of review specifically written for the common core math standards for 3rd grade. Be sure to download the sample for a full overview of what you get.
This resource is 100% EDITABLE!!! This gives you the ability to go into any problem and remove or change it. This feature is important because it gives you the control over what your students get each day/week. If something doesn't ali
Subjects:
Grades:
2nd - 4th
Types:
Living and Nonliving Things Science Vocabulary Bingo Activity
This is a Science Activity Lesson based on the Science Standard about Living and Nonliving Things. It also ties in with Math Standards regarding creating and reading bar graphs and number lines. While that standard pertains to 3rd grade many other grades need to review and reteach it to help students. This activity helps ESL students and others to master the vocabulary for the science standard as well. This activity is a DOK level 2 and 4 but is not complicated. It will take 3 days and all paper
Subjects:
Grades:
3rd - 11th, Adult Education
Types:
CCSS:

Editable Line Plot
Fully editable line plot for graphing units. Survey and complete the graph as a whole group or use in small group centers. Great for hands on practice with reading and interpreting line plots as well as creating them.
Subjects:
Grades:
2nd - 4th
Types:
CCSS:
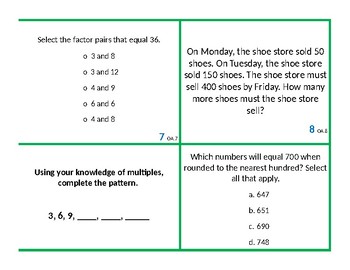
3rd Grade Math Standards Review for FSA
This product has 28 task cards for the 3rd grade MAFS Standards, which is almost exactly the same as the Common Core standards. This product has one task card for each standard to serve as a review prior to state testing. There are multiple question types to prepare students for the Florida Standards Assessment, or FSA. Question types include:Multiple Choice ResponseMulti-Select ResponseTable ResponseEquation ResponseThere are 25 total standards. I made a total of 3 cards for NF.3, since there a
Subjects:
Grades:
3rd - 4th
Types:

Create Your Own Survey Question and Bar Graph
Interpreting bar graphs can be a tricky skill for students. In my district, student benchmark results revealed this is one of the top struggles. Use this fun and simple packet to have it come alive for students. Students create their own survey question, collect data, bar graph the results, and answer questions about their OWN survey question. The packet is clear and student-friendly.
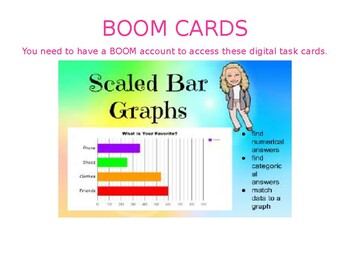
Scaled Bar Graphs with BOOM Cards
This product is a digtial deck from BOOM cards. It will help and guide your students with scaled bar graphs. It is a self assessing digital learning experience. BOOM cards are great and check the task cards for you! Enjoy.
Grades:
3rd - 5th
Types:
CCSS:
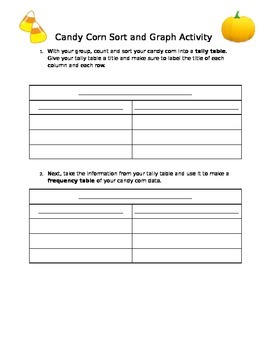
Candy Corn Sort and Graph Activity
This Halloween-themed activity allows students to practice sorting and graphing candy corn in a fun and cooperative manner. Teachers can place students in groups or with a partner and provide them with a small cup of multi-colored candy corn (usually available around Halloween). The students will then fill out a tally table about their candy, followed by a frequency table, and finally create a picture graph of the data. After organizing and graphing their candy corn data, students will answer a
Bar Graph Differentiated Tasks
3rd Grade Bar Graph Tasks.
3 Differentiated Tasks.
Each task has a challenge.
Perfect for using during/at the end of GoMath Chapter 2.
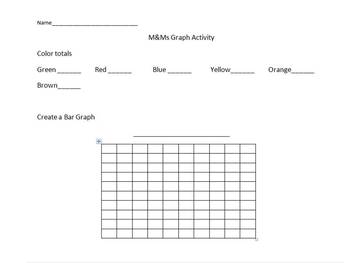
M&M Graph Activity
This worksheet is designed as a graphing lesson guide. The students each receive one worksheet and one bag of M&Ms. They then must sort the M&Ms and graph them on three different types of graph (bar, line, and circle). There are then questions attached to help students realize that some graphs are better than others to use to display the same data. Finally, students answer questions about mean, median, mode, and range of the data.
Subjects:
Grades:
3rd - 5th
Types:
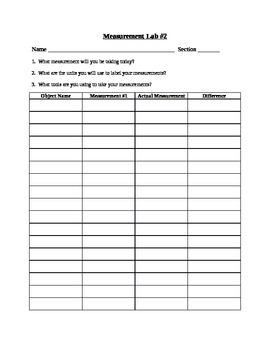
Mass Measurement Lab
A hands-on measurement lab where random objects are chosen to measure mass using pan balances or triple beam balances and a digital scale. Students will take the first measurement on a balance and then the second on the digital scale. They will then find the difference between the two measurements. The end of the lab questions discuss why there may be a difference between the two measurements. Extension acitivity: choose 5 objects and graph the results.
Subjects:
Grades:
3rd - 7th
Types:

Math Challenge Problems
These problems really get kids thinking! The are aligned with the grade 3 common core, but will challenge 4th and 5th grade students for sure. These work great as an extension activity once regular math work is completed. See how your high flyers do!
Subjects:
Grades:
3rd - 5th
Types:

Data and Graphing Project
Students can show what they know about data, tables, and graphs by completing this project. Students will gather information from classmates by conducting a survey, then creating a variety of tables and graphs using the data they collected. Includes a holistic rubric to use for assessment.
Subjects:
Grades:
3rd
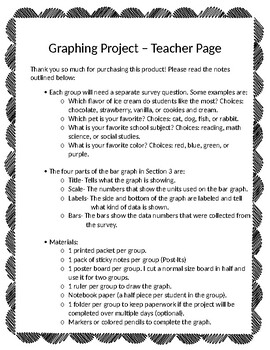
Graphing Project (Bar Graph)
This project is to be completed in small groups. Students will collect data from their classmates using a survey question. The data collected will be put into a frequency table and a bar graph created by the group members. Students will use a given rubric to evaluate their work.
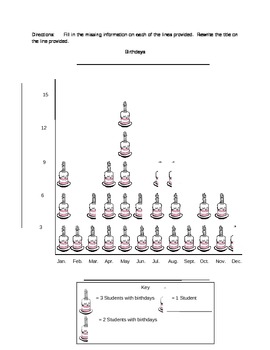
Birthday graphing
Students will read a graph and answer questions regarding graphing. Students will create addition and subtraction problems for the graph provided. Students will find the missing information about the graph provided. This lesson can be modified to use the birthdays from your own class. If you like my projects, please take a moment to rate my work and leave a comment.
Subjects:
Grades:
3rd
Types:
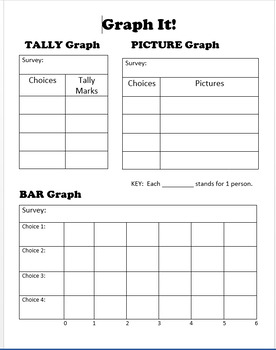
Graph It! Math Center
This is a simple math center that you can use for while you are teaching how to graph with students or a center you can use to help students practice the standard even when you are done teaching it.
This has students use tally marks, picture graphs, and bar graphs.
The rules, survey cards, graphs, and question cards are all included in this!
All you need are dice!
Subjects:
Grades:
2nd - 3rd
Types:
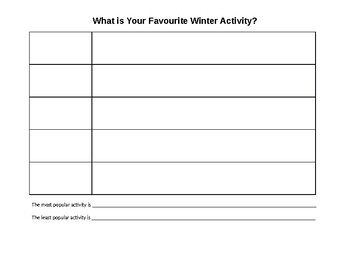
Winter Season Graphing Worksheet
A worksheet to allow students to connect with their environment and identify what they like to do in the winter and create a pictograph using their findings.

Creating Graphs
Students are able to think creatively to create their own survey question for the class. Students will collect data and create a graph using their information.
Subjects:
Grades:
2nd - 4th
Types:
CCSS:
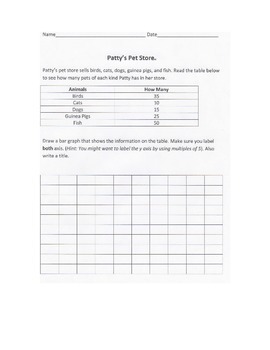
Third Grade Bar Graph Math Task
This Bar Graph task challenges third graders to work with multiples of 5. Students practice drawing a bar graph while also practicing their five times table. On page two there are questions about the graph that use common core math terms as well as asking students to create their own question.
Subjects:
Grades:
3rd
CCSS:

"Lemonade for Sale" Math Literature Station (Bar Graphs)
Students read the book, "Lemonade for Sale," by Stuart J. Murphy and then complete this station activity to go with it. Students will imagine the Elm Street Kids do another lemonade stand and answer questions about a graph with their new profits!
Subjects:
Grades:
2nd - 4th
Types:
CCSS:
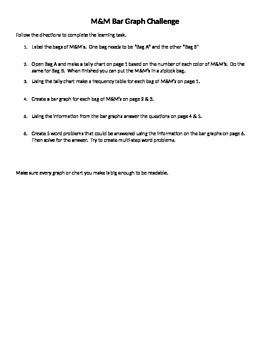
M&M Graphing Challenge
Need something to get your students interested in graphs? Utilize the M&M graphing challenge to excite the students. Students are challenged to create a tally chart, frequency table, and bar graph. Then they answer questions about their graphs and create their own.
Subjects:
Grades:
3rd - 5th
Types:
CCSS:

FREE Line Plot Activity
I made this resource to help extend student understanding of gathering data and creating a line plot based on the data. Great for 3rd graders! My students loved this activity.
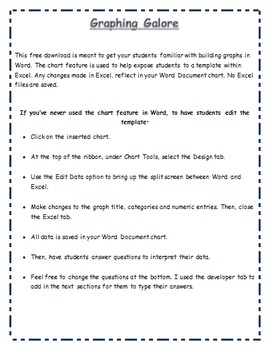
Graphing Galore with Word
This document helps your students create a bar graph in Microsoft Word. Students must use the data from the given tally chart to create their graph. From there, they are required to interpret the data and answer a few short questions at the bottom.
Graphing Test
This is a graphing test to assess 3rd grade measurement and data standards. Would be useful for test prep.
Subjects:
Grades:
2nd - 3rd
Types:
CCSS:
Showing 1-24 of 24 results

