45 results
Common Core 3.MD.B.3 centers for Microsoft PowerPoint
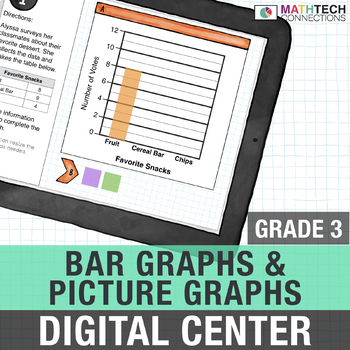
Bar Graphs & Picture Graphs 3rd Grade Paperless Test Prep Math Center | 3.MD.3
This paperless resource is specifically made for third grade students to review common core standard 3.MD.3 - I can draw a scaled picture graph and a scaled bar graph to represent a data set with several categories. I can use scaled graphs to solve one- and two-step problems.★ What's Included?★- Links to download the Google Slides ™- Directions on how to assign on Google Classroom ™- Practice 1 - 10 slides - Practice 2 - 10 slides - PowerPoint Version- Answer KeyPlease click PREVIEW for more det
Subjects:
Grades:
3rd
CCSS:
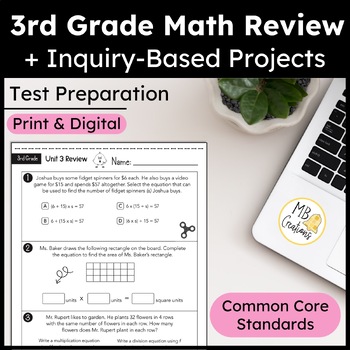
3rd Grade End of the Year Math Review iReady Test Prep Worksheets/Project/Slides
Use this 3rd grade end of the year math review to prepare students for iReady Math assessments. Save time and energy by implementing these test prep worksheets and child-friendly projects into your iReady Classroom Math routines. Share the inquiry-based projects with your early finishers and incorporate the digital slides into your iReady math routines. This resource provides extra practice for students as they prepare for unit and state testing, model their thinking, and solve problems. These r
Subjects:
Grades:
3rd
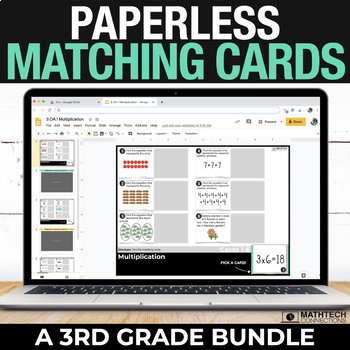
3rd Grade Digital Math Review - Interactive Google Slides Math Spiral Review
This 3rd grade digital math centers bundle includes matching cards for third grade math standards. Each set includes 18 cards that can be used during whole group instruction or assigned as a math center. This is a paperless version of the matching game from this bundle. ★ What's Included?★- 26 matching game sets - that's a total of - 18 cards per set - a total of 468 cards.- Answer KeyPlease Click PREVIEW for more details & a free samplePLEASE NOTE: You will need to grant TPT permission to a
Subjects:
Grades:
3rd
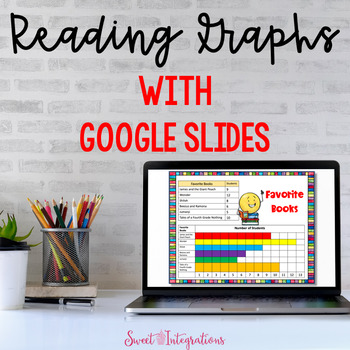
Reading and Interpreting Graphs With Google Slides - Digital Learning
Your students will love reading and interpreting different types of graphs with a variety of themes. I've included an editable PowerPoint which can be printed and implemented in Google Slides. To show their understanding, students will answer questions about each graph. Students can also create their own graphs in this resource.THE TYPES OF GRAPHS INCLUDED:Bar Graphs (horizontal and vertical)PictographsDouble Bar GraphsLine GraphsPie Graph or Circle GraphJust click on the link to go to the Googl
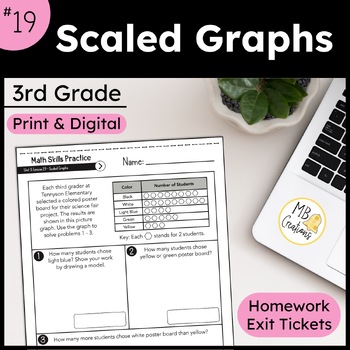
Scaled Graphs Math Worksheets & Exit Tickets - iReady Math 3rd Grade Lesson 19
Teaching students how to interpret scaled graphs with iReady Classroom Math 2020 requires a great deal of practice. Save time and energy by implementing these exit tickets, worksheets, and vocabulary activities into your iReady Classroom Math routines. This resource provides extra practice for students as they interpret scaled graphs, model their thinking, and solve problems. These rigorous math activities align with Common Core State Standards and prepare students for standardized testing. Che
Subjects:
Grades:
3rd
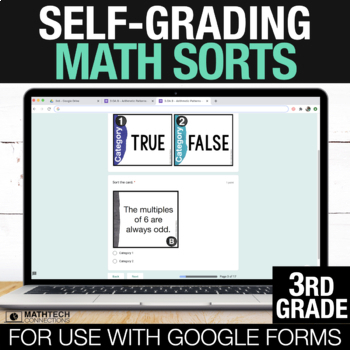
3rd Grade Self-Grading Math Sorts Digital Centers Paperless Math Review Games
This 3rd grade digital math centers bundle includes self-grading math sorts for third grade math standards. Each set includes 14-16 cards that can be assigned during math stations for review or taken as a quiz grade.This is a paperless version of the math sorts from this bundle. ★ What's Included?★- 26 self-grading Math Sorts- over 300 cards!Please Click PREVIEW for more details & a free samplePLEASE NOTE: You will need to grant TPT permission to add all 26 sets after you purchase this resou
Subjects:
Grades:
3rd
Graphing PowerPoint
Are you just starting graphing? Or need a review on graphing? Here is a Power Point (or save to Google Slides) that can be used to introduce or review! This Power Point reviews what a graph is, how to collect data, what a pictograph, bar graph, tally chart and plot graph is. Once reviewing these types of graphs, the students will practice with questions on each type of graph. * Check out Preview before purchasingCheck out other Graphing Products:• Graphing Worksheets• Bar Graph Power Point • Pi
Subjects:
Grades:
2nd - 3rd
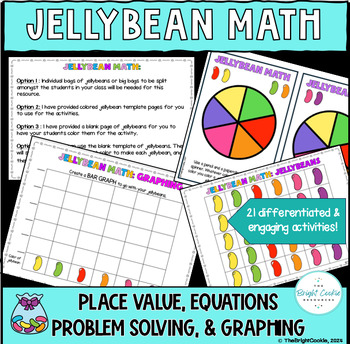
Jellybean Math: K-4th grade - Place Value, Graphing, Problem Solving, Fractions
This resource includes 31 pages and 10 differentiated and engaging activities. All the activities/pages in this resource are standards based. You can use this in spring around Easter (however, it isn’t not Easter related), or ANY time in the year in which you want to review graphing, place value, problem solving, equations/computation, and fractions. This product can be used as stations OR whole group activities. *If you would like to use real jellybeans for this activity, GO FOR IT! (We all kno
Subjects:
Grades:
K - 4th
Types:
Daily Graphing Activities
My students and I LOVE graphing! Data is one of those mathematical standards that can easily be integrated into science, social studies, art, and other content areas. Graphs are also so much fun, why save them for just your data unit?
This product contains 5 graphs. You can use one graph a day, which is what I like to do, or you can use the graphs as you see fit for your students. These daily graphs are meant to be used in a shorter amount of time. They are perfect as a 5-10 minute filler eithe
Subjects:
Grades:
K - 4th
Types:
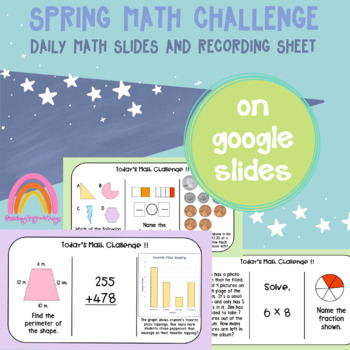
3rd Grade Spring Math Challenge Review Slides
Third grade end of year math review! Daily math challenge slides with 3 problems per slide to help students review all math concepts.I use this as a daily "warm up" with my students every day before our math lesson. Students attempt to answer the 3 problems on the slide. If they get them correct, they get to color in a box for that math topic on their recording sheet! Easy way for me to see what they know, and what they don't. If they don't get the problem correct, they simply do not get to colo
Subjects:
Grades:
2nd - 4th
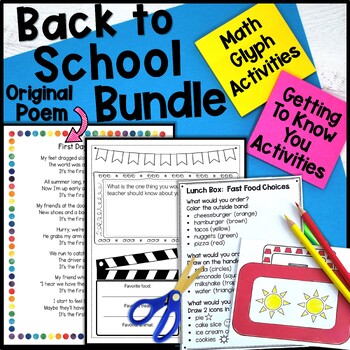
Back to School Math and Literacy Activities Bundle with Bonus
Those first few days can be both challenging and fun as you navigate a new year with a new group of students. Looking for some tried and true tips and activities for getting your year off to a great start? Check out this back-to-school activity bundle!☝ Click on the preview(s) to learn more!❤️Save more than 20% on the resources included by purchasing this Back to School Bundle!! What's included:Back to School Math Glyphs Getting to Know You Data:⭐ Handy Table of Contents with clickable links
Grades:
2nd - 4th
Types:
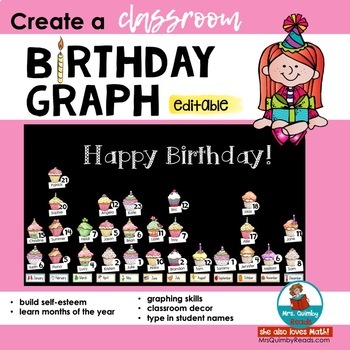
Birthday Graph | Bulletin Board Ideas | Self-Esteem |Graphing Skills | Math
Create a Class Birthday Graph! Build Self-Esteem! Would you like an engaging first week of school activity that brightens your classroom and teaches?Teach graphing skills and classroom community with this great beginning of the year activity and at the same time you and your students will be creating a beautiful classroom environment! Perfect for a first day of school activity. This teaching resource has everything you need to make this beautiful Class Birthday Graph: Colorful CupcakesMonths
Subjects:
Grades:
K - 3rd
CCSS:
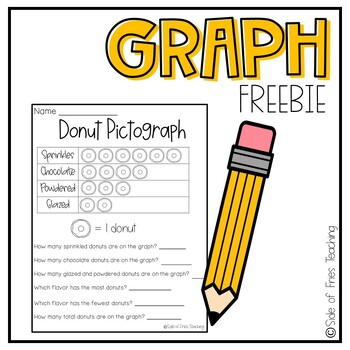
2nd and 3rd Grade Bar Graphs, Line Plots, and Pictographs FREEBIE
These line plots, bar graphs, and pictographs are perfect for math centers, whole group graph instruction, substitute, and review. This bundle of 1st, 2nd and 3rd grade graphs is no prep! These graphs are a perfect extra for your math instruction all year long. These graphs are easy to use, self guided instruction, and the perfect touch of fun for math!Graphing Practice Included in other graphing Products:Whole Class Graphing ActivityLine PlotsBar GraphsPictographsOther Graphing Products you may
Subjects:
Grades:
1st - 3rd
Types:
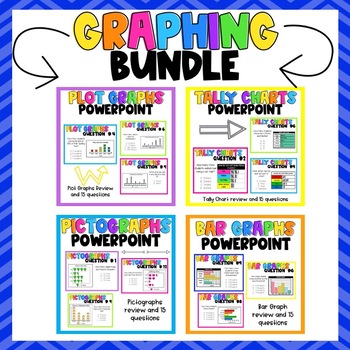
Graphs Power Points BUNDLE
Are you just starting graphing? Or need a review on graphing? Here is a Power Point (or save to Google Slides) that can be used to introduce or review Pictographs, Bar Graphs, Plot Charts and Tally Charts.This Power Point reviews what a Pictographs, Bar Graphs, Plot Charts and Tally Charts. is, and 15 slides to review questions with Bar Graphs. Great to use for distant learning, small group, whole group, RTI.
Subjects:
Grades:
2nd - 3rd
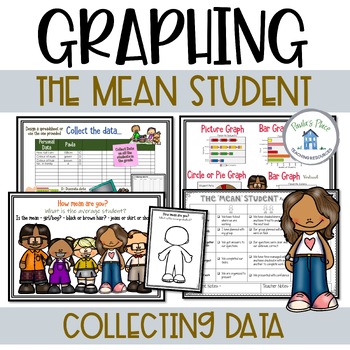
Graphing the Mean | Your Mean Student - Project Based Learning
Graphing the Mean - Your students will experience a math task that will lead to a group presentation. They will compose questions, collect data, collate data, determine the ‘mean’, show the data in various graphs and design a poster to present the ‘mean student’.Slides include-What the unit will cover-How mean are you? What will you be looking for?-What is the mean?-How mean are you?-Template for recording the mean student-Ideas for recording data-Group guidelines – it’s your turn-Types of graph
Subjects:
Grades:
4th - 6th
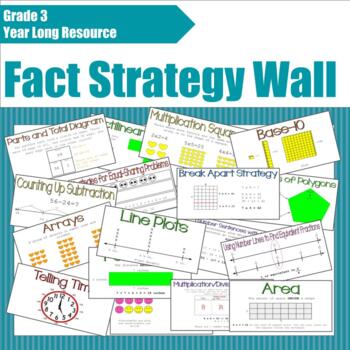
Math Strategy and Word Wall- GRADE 3
Check out this awesome back to school resource! An entire YEAR'S worth of math strategy wall cards, great for classroom visuals and differentiation support! I recommend printing the cards and putting them in page protectors so you can use them for years to come!Cards are separated by unit and the units are based on the EverydayMath 4 curriculum. Card topics include:Number StoriesMultiplicationDivisionMeasurementGeometryFractionsTelling TimeRounding NumbersAND MANY MORE!Check out my store for mor
Subjects:
Grades:
3rd - 5th
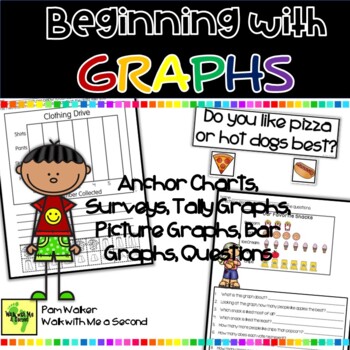
Graphing for Beginners | Tally Marks Picture Graphs Bar Graphs
This resource is designed for introducing graphing and offering a variety of practice tasks for primary learners. Here you get a beginning focus on tally graphs, picture graphs, and bar graphs for primary learners, saving line and circle graphs for older students. Since much of what is offered in media comes in the format of visuals, including graphs, we need to teach students how to interpret and analyze what the graphs or other visuals are trying to convey or not convey. This pack will make yo
Subjects:
Grades:
1st - 3rd
Types:
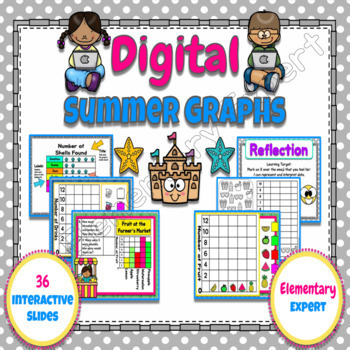
GOOGLE SLIDES MATH: Reading Graphs DIGITAL DISTANCE LEARNING
What's included: Digital directions Moveable Pieces & Interactive Text Boxes Learning Target & Reflection Anchor Charts (pictograph/bar graph)Extra Printable Pages (just in case...but EVERYTHING is digital)The entire deck is a total of 65 slidesI really hope you love this! Thank you!!!! Thank you!!!! Thank you!!!! Thank you so much for your purchase and for visiting my store. I am so grateful that you took the time to check it out. I hope you and your students enjoy using this resource
Subjects:
Grades:
1st - 3rd
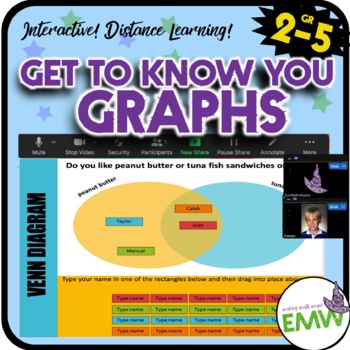
Distance Learning Back to School Get to Know You Graphs
This editable PowerPoint slide deck provides everything you need to help your students get to know each other as well as create graphs (bar chart, line plot, line chart, pie chart, and Venn diagram) with the data. Perfect for distance learning. You can also open this into Google Slides.Back to School Get to Know You Graphs Line plot, pie chart, Venn, etc.How can I use this for Distance Learning?You open this file. Read through all the tips and notes. Make any changes and adaptions you need for
Draw a Bar Graph
This Common Core measurement and data lesson covers how to draw a bar graph. The lesson includes research-based strategies and strategic questions that prepare students for Common Core assessments. In this lesson, students will read the given data set, write the given categories in the bar graph, and determine how high to draw the bar. In addition to the lesson, there are four pages of independent practice with questions modeled after the Common Core assessment items.
This lesson is a shockwave
Pictograph Power Point
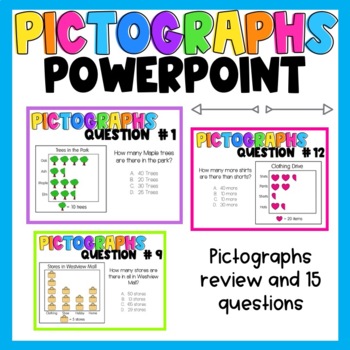
Are you just starting graphing? Or need a review on graphing? Here is a Power Point (or save to Google Slides) that can be used to introduce or review Pictographs.This Power Point reviews what a Pictograph is, and 15 slides to review questions with Bar Graphs. Great to use for distant learning, small group, whole group, RTI.Check out other Graphing Products:Graphing WorksheetsGraphing PowerPointBar Graph Power PointTally Chart Power Point
Subjects:
Grades:
2nd - 3rd
Also included in: Graphs Power Points BUNDLE
Digital 3rd Grade Math Test Prep Review Slides Bundle
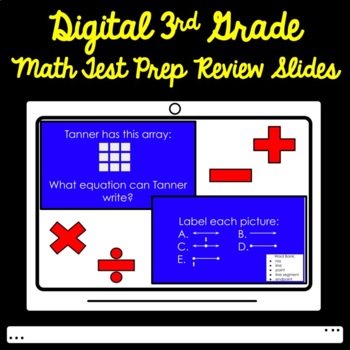
10 Slide Decks of Editable Math Review!Use these slides to review all third-grade math standards.Students use whiteboards to answer each question individually.Answers to each question are included on the following slide for students to check their work.Use as a pre-test, after teaching concepts, review before state testing, or before teaching new concepts in 4th grade.Can be used for in-person learning or distance learning!Questions Include:Place valueMultiplicationProperties of multiplicationDi
Subjects:
Grades:
2nd - 4th
Reading Picture, Bar, Frequency and Talley Charts
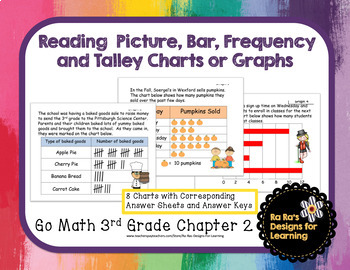
This product was designed to coordinate with Go Math 3rd Grade Chapter 2 Represent and Interpret Data but can be used more broadly since it is geared toward 3rd Grade Math Common Core standards.Product contains 8 charts that can be displayed on a smart board or printed and laminated for math center work. Each chart has a corresponding answer sheet with answer key.
Draw Picture Graphs
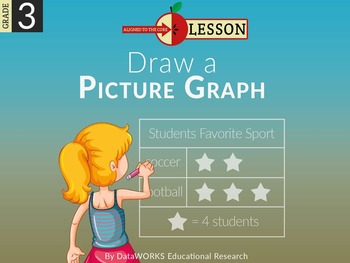
This Common Core measurement and data lesson covers how to draw a picture graph. The lesson includes research-based strategies and strategic questions that prepare students for Common Core assessments. In this lesson, students will read the given data set, write the given categories in the picture graph, and determine how many pictures to draw for each category by dividing the category value by the key value. In addition to the lesson, there are four pages of independent practice with questions
Showing 1-24 of 45 results

