9 results
Earth sciences Common Core 3.MD.B.3 centers
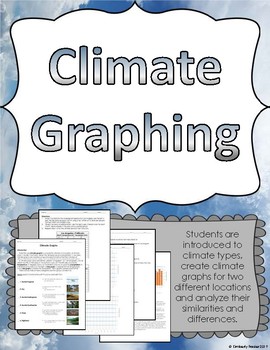
Climate Graphing Activity
Help students understand the basics of climate through this graphing activity. Not only does this address the science standards, it also integrates math and data analysis.Included in this printable graphing activity:-Introduction to what climate graphs are-Descriptions of 6 major types of climates-Directions for how to make a climate graph-Climate graph set ups-Data for two locations: New York City and Los Angeles-Analysis questions comparing the two climate graphs (use of CER)-Set of climate gr
Subjects:
Grades:
3rd - 9th
Types:
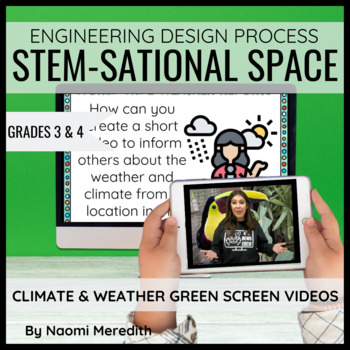
Weather for 3rd Graders STEM Project | Green Screen Video
How does the weather and climate change in different locations in the world? Understanding this information helps inform people when and where they might want to travel to a place. How can you create a short video to inform others about the weather and climate from a location in the world? By going through the Engineering Design Process, you’ll research about one location in the world and its weather and climate for each season and what people like to do for fun in this place. With this informat
Grades:
3rd - 4th
Types:
NGSS:
3-5-ETS1-3
, 3-ESS2-1
, 3-5-ETS1-1
, 3-ESS2-2
, 3-5-ETS1-2
Also included in: STEM Project Ideas for 3rd Grade | Growing Year Long Bundle
World Weather and Climate Stations Analysis and Graphing for Science and Math
Set up these 6 stations to encourage students to develop their graph-reading skills and help students recognize differences between weather and climate. Simple to use in math or science lessons. Just print, cut, and tape! For today's weather, please visit Accuweather.In this PacketPg 2 Preview Washington DC Fahrenheit (together as a class, one per student)Pg 3-4 Student Handout (print double sided, one per student)Pg 5 Buenos Aires/Cairo Fahrenheit (cut in two and tape one per station)Pg 6
Subjects:
Grades:
3rd - 6th
Types:
NGSS:
3-ESS2-1
, 3-ESS2-2
Also included in: World-focused Science and Math Activities for Upper Elementary
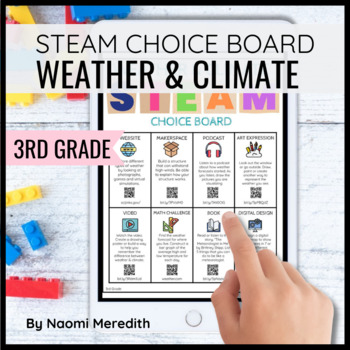
Weather for 3rd Graders | STEAM Choice Board
Have a one-stop location for various STEAM resources for third grade students to explore weather & climate further. Students can choose out of the 8 resources and activities provided to deepen their learning.While not designed to be the core lesson for teaching, this is a standards-based, extension resource that can be used alongside existing units. ---------------------------------------------Digital & Printable choice board with clickable links, QR codes and shortened-links to be acces
Grades:
3rd
Types:
NGSS:
3-ESS3-1
, 3-ESS2-1
, 3-ESS2-2
Also included in: 3rd Grade STEAM Choice Board Bundle
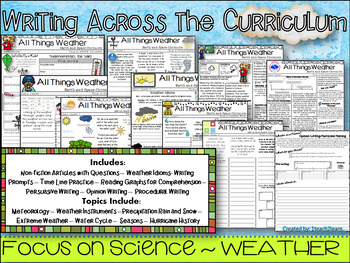
Weather - Science - Writing across the Curriculum - Reading Comprehension
This packet includes 10 lessons that can be used to teach all about Weather.Packet includes:6 Creative Writing Newspapers (18 total writing prompts)2 Non-fiction Passages with Comprehension Questions -Extension Activity: Write an opinion Piece about Hurricane Etymology 1 Newspaper that focuses on Weather IdiomsThis packet also helps students practice their Math and ELA skills! Math Skills:-Reading a Graph and answering comprehension questions-Reading and understanding a Time LineELA Skills:
Subjects:
Grades:
3rd - 4th
Types:
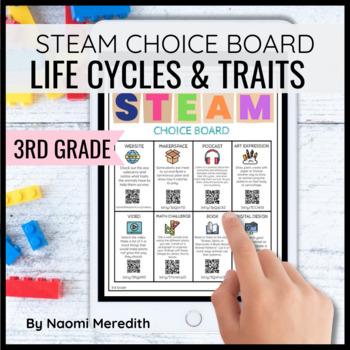
Life Cycles 3rd Grade | STEAM Choice Board
Have a one-stop location for various STEAM resources for third grade students to explore life cycles & traits further. Students can choose out of the 8 resources and activities provided to deepen their learning.While not designed to be the core lesson for teaching, this is a standards-based, extension resource that can be used alongside existing units. ---------------------------------------------Digital & Printable choice board with clickable links, QR codes and shortened-links to be ac
Grades:
3rd
Types:
NGSS:
3-ESS3-1
, 3-ESS2-1
, 3-ESS2-2
Also included in: 3rd Grade STEAM Choice Board Bundle
Excel Graphing Temperature Comparison
What's the temperature like in YOUR town? Does your curriculum include a study of weather factors? This Temperature Comparison Excel double-bar graph project can be an engagingway to:* integrate technology, math, science, and geography* introduce, extend, or enrich a math, social studies, or science topic of study* introduce or practice creating sheets and charts using Excel* give students a chance to make connections across the content areasThis classroom-tested project file includes: * student
Grades:
4th - 6th
Types:
NGSS:
5-ESS1-2
, 3-ESS2-1
, 3-ESS2-2
, 5-ESS2-1
, MS-ESS2-6
...
Earth's Systems: Weather, Climate, & Patterns!
Great Science and crossover Math activity which covers weather, climate, and patterns as well as bar graphs & pictographs.
Subjects:
Grades:
3rd - 4th, Staff
CCSS:
NGSS:
3-ESS2-1
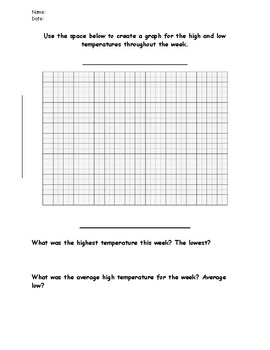
Weather Graphing Worksheet
This worksheet can be used to graph various weather patterns. There is a page to graph high and low temperatures using a bar graph. Another page is included to graph weather and cloud type using picture graphs. There are also analyzing questions for each graph.
Subjects:
Grades:
2nd - 5th
Types:
CCSS:
Showing 1-9 of 9 results

