27 results
Graphing Common Core HSS-ID.A.1 activities
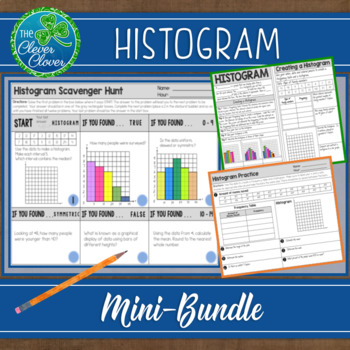
Histogram - Notes, Practice Worksheets and Scavenger Hunt
This histogram resource includes guided notes, a practice worksheet and a scavenger hunt. Your students will have the opportunity to create, interpret and discuss histograms. Below, you will find a detailed description of the notes, worksheet and scavenger hunt. Guided NotesThere are two small pages of guided notes. The first page provides the definition of a histogram and step by step instructions on how to create a histogram. The bottom portion of the notes has students examine three types (un
Subjects:
Grades:
6th - 9th, Adult Education
CCSS:
Also included in: Statistics Bundle - Guided Notes, Worksheets & Scavenger Hunts!

42 Blank Graph Templates: Horizontal & Vertical Bar Graph, Line Graph, Printable
Looking for an array of printable graph templates for all your future bar and line graph needs? Look no further! With 42 different templates ranging for bar graphs, to line graphs, varying in X values and Y values, this combination should be the last graph download you need to worry about for your class. These graphs can even be used as Histograms, Dot Plots, Scatter Plots, or a variety of other graphs to suit the needs of your classroom.I created this template to require all the basics of gr
Grades:
4th - 12th
Types:

Statistics Survey Project - Project Based Learning (PBL) with Math
Watch your students dive into the world of math as they create, execute, and analyze their own survey! Students will demonstrate mastery of data gathering, survey sampling, developing appropriate survey questions, data tables, Direct Variation, discrete graphs, dot plots, box and whisker graphs, and calculating the inter-quartile range.The Unique Survey Project is highly engaging, capitalizing on the innate curiosity of the adolescent mind. You will love the low-prep instructional guide. Your st
Subjects:
Grades:
6th - 10th
Types:
Also included in: Fun with Ratios Activities Bundle - 7th Grade PBL with Math
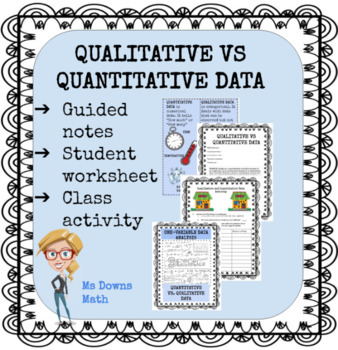
Qualitative vs Quantitative Data
This lesson provides notes as well as a note taking guide and exercise for students. There is also a class activity meant to get students thinking about how we graph different types of data. Students usually have no trouble with the categorical data, but sometimes get stumped as to how to graph the numerical data. With a little motivation, they can usually come up with a dot plot or stem and leaf plot if they are familiar with that type of graph. This is a fun activity for students as they are g
Subjects:
Grades:
7th - 12th
Types:
CCSS:
Fun with Ratios Activities Bundle - 7th Grade PBL with Math
The purpose of the Fun with Ratios Activities Bundle is to give students the opportunity to use creativity to apply ratios, proportions, and percentages in real-world settings. This bundle includes three unique tasks: Black Friday Mastery Task, Direct Variation Poster Mastery Task, and the Unique Survey Project. These activities and their accompanying materials are suited for students in grades 7 through 9. These lessons make excellent sub plans. Each project takes approximately two 60-minute bl
Subjects:
Grades:
7th - 9th
Types:
Introduction to Statistics (DS1): S.IC.A.1, S.ID.A.1
Students will begin to explore statistics by collecting and processing data using the mean, median and mode. This mission is aligned with Common Core State Standards: HSS.IC.A.1, HSS.ID.A.1.
The fun stuff:
Numbers, numbers everywhere but don't forget to stop and think! Now more than ever the world is awash in data and statistics. Students consider the practice of statistics and what a statistic is by debating the number of hours of sleep they need, the age at which the brain reaches full maturi
Subjects:
Grades:
7th - 12th
CCSS:
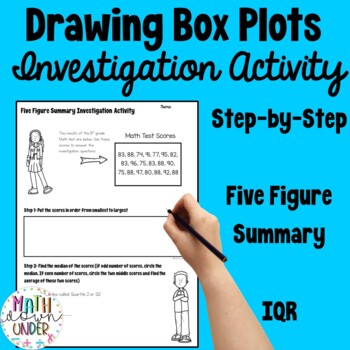
Drawing Box and Whisker Plots Investigation + Practice
Your students will love this three page activity that guides them through the steps to create a box and whisker plot. Calculating the Five Figure Summary (min value, Q1, Q2, Q3, and max value), Interquartile Range, and then drawing Box and Whisker Plots are all included. Have a look at the preview file to get a better idea of what this product looks like. Follow my store and thank you for your support!Want the digital, Google Slides version? Find it here:Related Products• Box Plots Digital Inves
Subjects:
Grades:
5th - 12th
Types:
CCSS:
Also included in: Box Plots - Print and Digital Activity Bundle
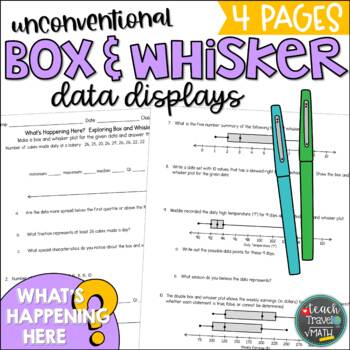
Unconventional Box and Whisker Plots
Looking for a way to challenge your students? This activity includes 4 pages of box and whisker data display questions. Scenarios produce unconventional box and whisker outcomes that have students thinking outside the box. See what I did there. Great for extra practice AFTER students have already studied box and whisker type statistical questions. This was designed for my higher-level 6th grade thinkers, but I've also used them for my Algebra kiddos. Questions include:box and whiskers with
Subjects:
Grades:
6th - 9th
Types:
Also included in: 6th Grade Math Bundle
6th-9th Grade Gummy Bear Math Activity- Data and Statistics
This is a fun (and yummy) Math activity created to review data and statistics concepts from 6th grade. Fun test practice/review! It can also be used as review or instruction for 7th-9th grades.You WILL need to buy gummy bears! Students will sort and count, then compare their bears with others.This is printable. But, included in the download is an editable Google Doc. Also, I have included a grading rubric and vocabulary sheet that can be printed for student binders/notebooks.Concepts covered:Me
Subjects:
Grades:
6th - 9th
Types:
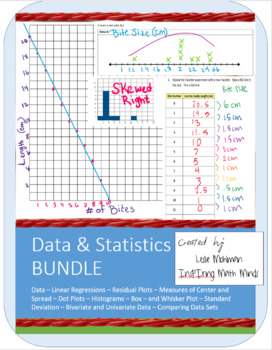
Bundle: Data and Statistics Unit and Twizzlers Project
This bundle includes a 5 lesson unit and a 5 part project.The project, students collect data, create graphs: scatterplots, dot plots, histograms, box-and-whisker plots. They analyze bivariate data by drawing lines of best fit, finding the correlation coefficient, linear regressions, and residual plots. They analyze univariate data looking at its shape (symmetric or skewed) and calculating the appropriate centers and spreads. With this fast and easy method of data collection, students each get
Subjects:
Grades:
7th - 12th
Types:
CCSS:
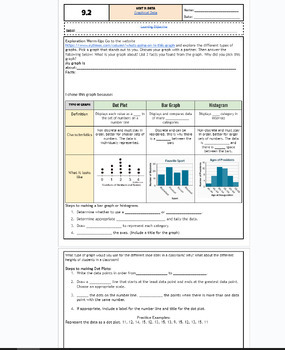
Graphical Data: Bar Charts, Dot Plots and Histograms fillable notes UPDTD
Unit 9: Data and Stats: UpdatedUpdated9.2 Graphs: bar, dot plot, histpgramStudents go over the vocabulary and define each type fo graph and what data fits for each graph. The warm up is an exploratory activity where students go on a website to search for their graph of interest and discuss the key findings. This takes around 10-15 mins and students enjoyed it! Notes are scaffolded. Includes hook video hyperlinked on the "learning objective" title. Key is included and hyperlinked as a PDF in the
Subjects:
Grades:
6th - 12th, Higher Education, Adult Education
CCSS:
Also included in: Unit 9: Data and Statistics Fillable Notes
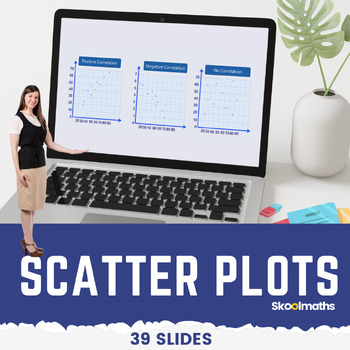
Eight Grade Scatter Plots Digital Math Lesson and Activities CCSS 8.SP.A.1
Eight Grade Scatter Plots Digital Math Lesson and ActivitiesTeach your high school grade how to use and interpret scatter graphs; recognize correlation; draw and use lines of best fit to make predictions?In this lesson, learners will be able to:use and interpret scatter graphs of bivariate data;recognize different types of correlation;draw estimated lines of best fit; anduse lines of best fit to make predictions.
Subjects:
Grades:
8th - 10th, Staff
Types:
CCSS:
6 Editable Bar Graph Templates 2.0
Finally a simple and professional graph space that students can fill out without any design issues getting in the way. This file contains 6 ready-to-use graph options. Print them and have students fill them with pencil and ruler, or distribute them over computer and let them practice entering the data. Get a project perfect finish every time. Maybe you just want to fill it out live on a projector? The possibilities are endless! It's okay to say you love these bar graphs. So do we.Contains:- 2 bl
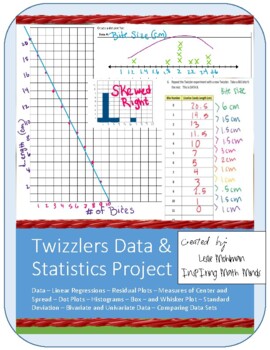
Twizzlers Data and Statistics Project in 5 Parts
In this project, students collect data, create graphs: scatterplots, dot plots, histograms, box-and-whisker plots. They analyze bivariate data by drawing lines of best fit, finding the correlation coefficient, linear regressions, and residual plots. They analyze univariate data looking at its shape (symmetric or skewed) and calculating the appropriate centers and spreads. With this fast and easy method of data collection, students each get their own data and most students will get one set of d
Subjects:
Grades:
7th - 12th
Types:
CCSS:
Also included in: Bundle: Data and Statistics Unit and Twizzlers Project
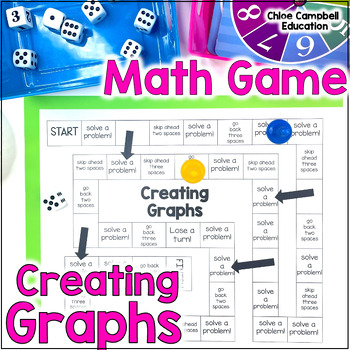
Creating Graphs Game - Box Plots, Stem and Leaf Plot, Circle Graphs Activity
You found the perfect creating graphs activity! Your 7th grade students will LOVE practicing or reviewing how to create graphs like box plots, circle graphs, and stem and leaf plots. Students will answer 20 questions in the game.This download has a directions, a board game, 20 questions, student recording sheet to hold them accountable, and a teacher answer key. View the preview above to see a detailed look at everything in this download. Grab this game in the year-long bundle!The following item
Subjects:
Grades:
7th
Types:
CCSS:
Box and Whiskers Printable & Digital Activity - Basketball Mathlete
***THIS PRODUCT HAS BEEN UPDATED WITH A GOOGLE SLIDES INTERACTIVE VERSION INCLUDED. REDOWNLOAD IF YOU HAVE IT ALREADY***Mathlete Sports Tasks are hypothetical situations geared to a sports fan that require them to step inside the white lines! Millions of students and teachers enjoy sports and these tasks leverage the vast math applications and layer them critical thinking skills. Students must analyze data, perform calculations, construct multiple arguments with the data, AND make a decision. Al
Subjects:
Grades:
6th - 12th
Types:
CCSS:
Also included in: Mathlete Sports Tasks - PRE-ALGEBRA Printable & Digital Activities
Histogram & Line Plots - EDITABLE Slides, INB & Tests+++ Drive Math
Drive Instruction with instructional resources that live in the cloud on Google Drive! All of the docs are COMPLETELY EDITABLE and can be differentiated to meet your needs or the needs of your students. PDFs are also included in the download if you prefer them that way. Each Drive Instruction set includes warm-ups, exit tickets, notes, presentations, digital interactive notebooks and tests. These are designed to be complementary to all of my innovative supplemental resources and an improvement o
Subjects:
Grades:
6th - 9th
CCSS:
Also included in: Complete Pre-Algebra - EDITABLE Slides / INB/ Warm-Ups / Notes / Test+++
Histograms Printable & Digital Activity - Cross Country Mathlete
***THIS PRODUCT HAS BEEN UPDATED WITH A GOOGLE SLIDES INTERACTIVE VERSION INCLUDED. REDOWNLOAD IF YOU HAVE IT ALREADY***Mathlete Sports Tasks are hypothetical situations geared to a sports fan that require them to step inside the white lines! Millions of students and teachers enjoy sports and these tasks leverage the vast math applications and layer them critical thinking skills. Students must analyze data, perform calculations, construct multiple arguments with the data, AND make a decision. Al
Subjects:
Grades:
5th - 12th
Types:
CCSS:
Also included in: Mathlete Sports Tasks - PRE-ALGEBRA Printable & Digital Activities

Stem & Leaf Plots - EDITABLE Slides, INB & Tests+++ Drive Math
Drive Instruction with instructional resources that live in the cloud on Google Drive! All of the docs are COMPLETELY EDITABLE and can be differentiated to meet your needs or the needs of your students. PDFs are also included in the download if you prefer them that way. Each Drive Instruction set includes warm-ups, exit tickets, notes, presentations, digital interactive notebooks and tests. These are designed to be complementary to all of my innovative supplemental resources and an improvement o
Subjects:
Grades:
6th - 9th
CCSS:
Also included in: Complete Pre-Algebra - EDITABLE Slides / INB/ Warm-Ups / Notes / Test+++
Box & Whisker Plots - EDITABLE Slides, INB & Tests+++ Drive Math
Drive Instruction with instructional resources that live in the cloud on Google Drive! All of the docs are COMPLETELY EDITABLE and can be differentiated to meet your needs or the needs of your students. PDFs are also included in the download if you prefer them that way. Each Drive Instruction set includes warm-ups, exit tickets, notes, presentations, digital interactive notebooks and tests. These are designed to be complementary to all of my innovative supplemental resources and an improvement o
Subjects:
Grades:
6th - 9th
CCSS:
Also included in: Complete Pre-Algebra - EDITABLE Slides / INB/ Warm-Ups / Notes / Test+++
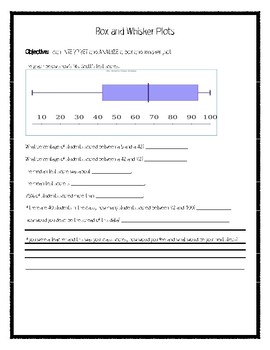
Box and Whisker Plot Analysis Worksheet
This take box and whisker plots to the next level. Students are given box and whisker plots and they need to interpret, analyze and compare them. Great for students who need a little bit more.
Subjects:
Grades:
8th - 11th
Types:
CCSS:
Bar Graphs Printable & Digital Activity - Basketball Mathlete
***THIS PRODUCT HAS BEEN UPDATED WITH A GOOGLE SLIDES INTERACTIVE VERSION INCLUDED. REDOWNLOAD IF YOU HAVE IT ALREADY***Mathlete Sports Tasks are hypothetical situations geared to a sports fan that require them to step inside the white lines! Millions of students and teachers enjoy sports and these tasks leverage the vast math applications and layer them critical thinking skills. Students must analyze data, perform calculations, construct multiple arguments with the data, AND make a decision. Al
Subjects:
Grades:
3rd - 8th
Types:
CCSS:
Also included in: Mathlete Sports Tasks - ELEMENTARY Printable & Digital Activities
Shape, Center and Spread (DS2): HSS.ID.A.1, HSS.ID.A.2...
Students will gather data, compute statistics, represent the data graphically and interpret patterns in the data. This mission is aligned with Common Core State Standards: HSS.ID.A.1, HSS.ID.A.2, HSS.ID.A.3.
The fun stuff:
Heart rates, mid-day temperatures and marathons! Hey, those all seem rather related! Students will gather their own data as well as working with given data to visualize and calculate shape, center and spread. Box plots, medians, outliers and more are explored. A fun introduct
Subjects:
Grades:
7th - 12th
CCSS:

Long Jump Data Collection Activity: Analyze the Measures of Center
This small group activity is designed as a formative assessment. Students complete 4 long jumps each and record their lengths. They discuss and analyze the data using the measures of center. Students then choose and construct the best graph to display the data. After small group discussion, measures of center data is recorded for the entire class and analyzed. Students will also determine whether the measures of center are valid means for a whole group.
Subjects:
Grades:
6th - 10th
Types:
CCSS:
Showing 1-24 of 27 results


