49 results
3rd grade statistics activities for Google Apps
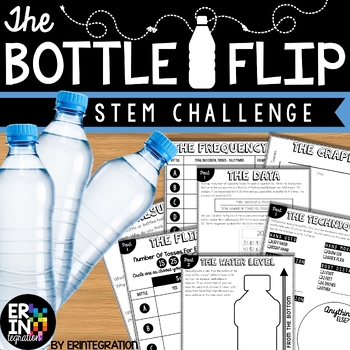
Water Bottle Flip STEM Challenge + STEM Activity
The ORIGINAL water bottle flip STEM activity and lab! Water bottle flip at school? Absolutely! Students will love this on-trend STEM challenge inspired by the popular YouTube water bottle flipping challenge where students toss a water bottle and attempt to land it straight up. Practice scientific method with some probability, fractions and data collection in the mix while having fun!This self-paced, low-prep, project based learning water bottle flip STEM challenge is print-and-go. Each activit
Subjects:
Grades:
3rd - 6th
Types:
CCSS:
NGSS:
K-2-ETS1-2
, K-2-ETS1-3
, MS-ETS1-2
, K-2-ETS1-1
, 3-5-ETS1-3
...

Bar Graphs Whodunnit Activity - Printable & Digital Game Options
Nothing like a good criminal investigation to liven up bar graphs! Based off my popular CSI projects, I have created Whodunnits? The Whodunnits plan to focus on single content topics as opposed to units and will focus more on skill building than application. Every day can't be a project day, so Whodunnits can be an engaging out of their seat activity to practice important skills. In a Whodunnit?, students will work in teams to solve 10 practice problems that increase in difficult. After each ans
Subjects:
Grades:
3rd - 8th
Types:
CCSS:
Also included in: Pre-Algebra Whodunnit Activity Bundle - Printable & Digital Game Options
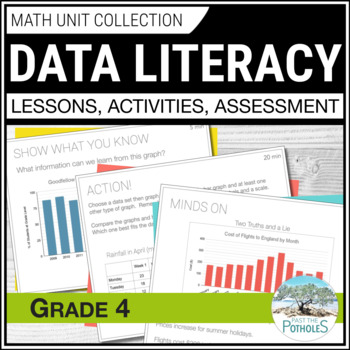
Grade 4 Ontario Data Management Unit Collecting Data Reading Graphs Infographic
Save time and stress! This COMPLETE Data Literacy unit includes EVERYTHING YOU NEED to guide students with collecting data, analyzing data, reading graphs, finding averages. It includes 3-part math Google Slides lessons, projectable slides for following along, taking notes, and creating anchor charts. It also includes practice worksheets, review activities, math centres, assessments, and Ontario math report card comments. Lesson topics: ❉ Describe and Compare Qualitative & Quantitative D
Subjects:
Grades:
3rd - 5th
Types:
CCSS:
CSI: Representing Data Activity - Printable & Digital Review Game
Nothing like a good criminal investigation to liven up data analysis! In this project, students will work in teams to investigate the culprit of six fictional thefts. The criminal has left six messages, layered with practice. Teams will work to build a case and present their findings to the court. Hopefully they are convincing enough to win the verdict.This is a elementary unit with a puzzle solving hook causes many different students to engage in solving traditionally mundane problems. 4th and
Subjects:
Grades:
3rd - 6th
Types:
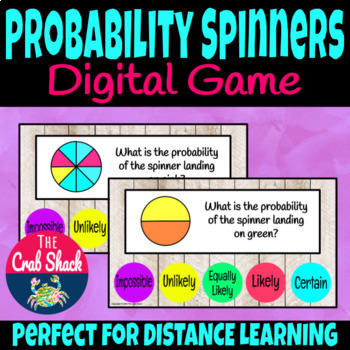
Probability Spinners Game *DIGITAL ACTIVITY*
Looking for a fun way for your students to review probability? This digital probability spinners game is perfect for teaching, reviewing or even assessing probability! Students will determine the probability of a spinner using the terms impossible, unlikely, equally likely, likely and certain. Students will click buttons that will take them to the next question, or have them retry the question that they missed. This game is fun and engaging, while also offering beneficial practice with this impo
Subjects:
Grades:
3rd - 5th
Types:
Also included in: Probability Bundle *DIGITAL ACTIVITIES*
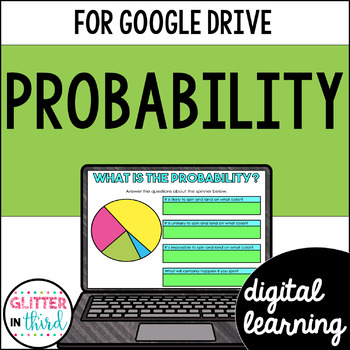
Probability Activities for Google Classroom Digital
These digital activities will give students practice with probability, including outcomes and likelihood. This digital resource uses Google Slides™ and can be used on Google Classroom and Google Drive. This resource also includes an answer key.This product includes:Drag-&-drop: vocabulary & definition match (probability, outcome, sample space, experiment)Drag-&-drop: match vocabulary word with example (experiment, outcome, sample space)Drag-&-drop:match the label to each part of
Subjects:
Grades:
3rd
Types:
Also included in: 3rd Grade Math SOL Activities Virginia Google Classroom
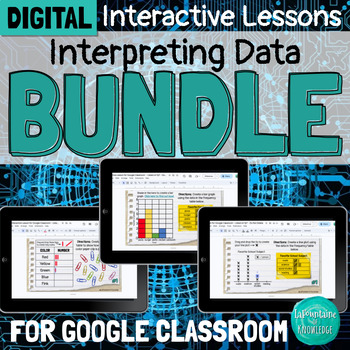
DIGITAL Interpreting Data Interactive Lesson Bundle for Google Classroom
This bundle of 3 digital interactive math lessons for Google Classroom teaches interpreting categorical and numerical data using frequency tables, bar graphs, and line plots. Each lesson includes: a video lesson (YouTube and Loom viewing options included) practice problems and activitiesteacher directions and answer keysThese lessons are ready to assign and easy for students to complete independently. Students will learn:important vocabulary - title, categories, tally marks, key, categorical dat
Subjects:
Grades:
3rd - 5th
Types:
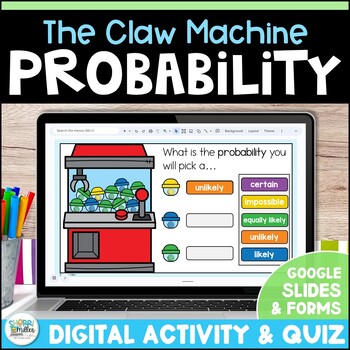
Probability Digital Math Activities and Assessment - Google Slides & Forms
Make teaching probability and chance fun with these engaging digital Google Slides math activities and Google Forms self-grading assessment! Your students will love the claw machine theme that is perfect to explain the likelihood of an outcome. These easy to use resources are also NO PREP to save you planning time! No need to take papers home to grade! The Google Forms quiz will test your students’ understanding of probability and give you instant data. ➡️ Click the PREVIEW above to see more i
Subjects:
Grades:
2nd - 4th
Types:
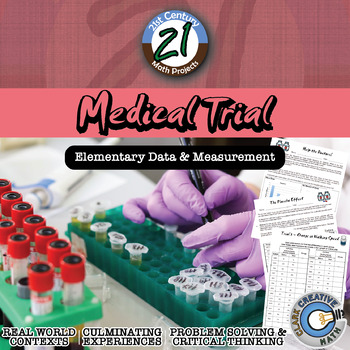
Medical Trial -- Elementary Data Edition - Medical - 21st Century Math Project
Bring your students into the world of double blind medical studies. Every day, doctors and hospitals rely on scientific studies and research to make healthcare decisions for patients. Are some medicines more effective than others? Do certain types of patients benefit more from certain types of treatments? Due to the security of medical records, studies are somewhat limited in their scope and are generally carried out at universities and research hospitals. At these facilities ground breaking wo
Subjects:
Grades:
3rd - 5th
Types:

Line Graphs Whodunnit Activity - Printable & Digital Game Options
Nothing like a good criminal investigation to liven up line graphs! Based off my popular CSI projects, I have created Whodunnits? The Whodunnits plan to focus on single content topics as opposed to units and will focus more on skill building than application. Every day can't be a project day, so Whodunnits can be an engaging out of their seat activity to practice important skills. In a Whodunnit?, students will work in teams to solve 10 practice problems that increase in difficult. After each an
Subjects:
Grades:
3rd - 8th
Types:
Also included in: Pre-Algebra Whodunnit Activity Bundle - Printable & Digital Game Options
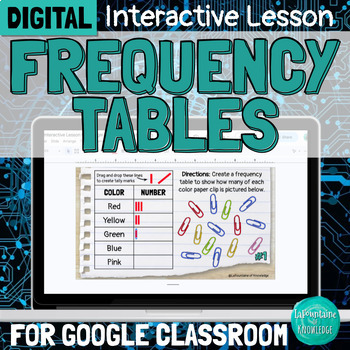
DIGITAL Frequency Tables Interpreting Data Interactive Lesson
This interactive Google Slides lesson introduces students to frequency tables and demonstrates how to interpret both categorical and numerical data. The lesson covers:the parts of a frequency table (title, categories, and tally marks)the difference between categorical and numerical datahow to interpret data (answer questions) using a frequency tablehow to create a frequency table This resource includes:a 9 minute video lesson (YouTube and Loom viewing options provided) 14 practice problems - stu
Subjects:
Grades:
3rd - 5th
Types:
Also included in: DIGITAL Interpreting Data Interactive Lesson Bundle for Google Classroom
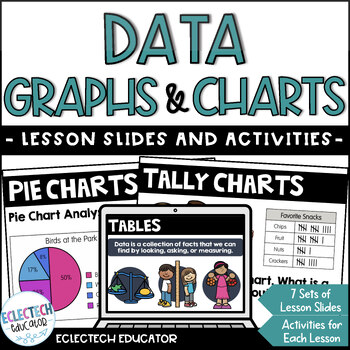
Data Management Collection, Charts and Graphs Digital Slides & Activities
Looking for fun ways to have students understand data? This math resource has everything you need to help students collect, describe, and represent statistical information using a variety of graphs and charts, such as bar graphs and pie charts. The SEVEN lessons, each with lesson slides, information, interactive activities, and practice questions, provide many opportunities to collect and represent data. TOPICS:⭐ Tables⭐ Tally Charts⭐ Bar Graphs⭐ Pictographs⭐ Pie Charts⭐ Line Plots⭐ Line GraphsE
Subjects:
Grades:
3rd - 4th
Types:
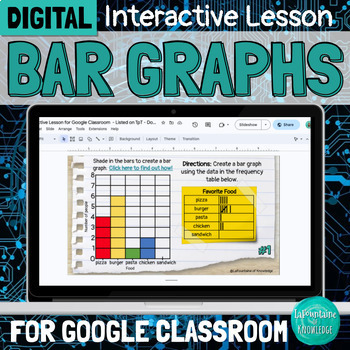
DIGITAL Bar Graphs Interpreting Data Interactive Lesson for Google Classroom
This interactive Google Slides lesson introduces students to interpreting categorical and numerical data using bar graphs (including scaled bar graphs).The lesson covers: how to create a bar graph the difference between categorical and numerical datahow to interpret data using different types of bar graphs to answer questions how to read a scaled bar graphThis resource includes: a 10.5 minute video lesson (YouTube and Loom viewing options included) 21 practice problems - students shade in sectio
Subjects:
Grades:
3rd - 5th
Types:
Also included in: DIGITAL Interpreting Data Interactive Lesson Bundle for Google Classroom
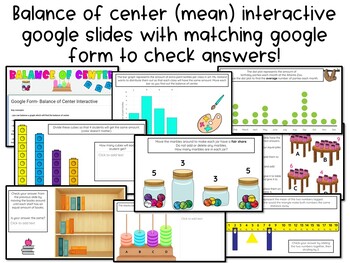
Balance of Center | Mean as Fair Share Interactive Google Slides w/ Google Form
18 slides of different interactive activities giving students an opportunity to move around online math manipulatives to find the balance of center and mean as fair share. There is a google form that goes along with the slides so students can get instant feedback. Examples:- balancing a bar graph- balancing a dot plot- sharing money to find the fair share between four friends- moving marbles around in different jars to find the mean of marbles per jar- moving snap cubes to balance the four grou
Subjects:
Grades:
3rd - 8th
Types:

Bar Graphs/Pictographs Self-Paced Work
Students will pull data and complete bar graphs and pictographs on various culturally relevant topics! They will have to have a good understanding of both types of graphs, tallies and tables. Includes one to one correspondence and many-to-one correspondence. (pictographs) Post to google classroom and have your students complete the questions at their own pace. Each different type of slide has expectations and instructions. A great activity to have on hand for early finishers or for a sub day!
Subjects:
Grades:
2nd - 4th
Types:
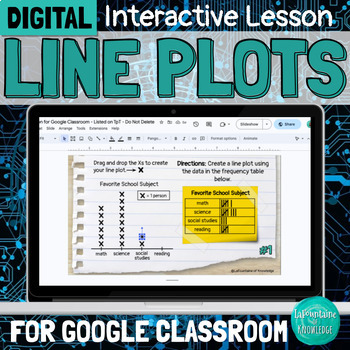
DIGITAL Line Plots Interpreting Data Interactive Lesson for Google Classroom
This interactive Google Slides lesson introduces students to interpreting categorical and numerical data using line plots which are also called dot plots (including scaled line plots).The lesson covers:how to create a line plot using the data in a frequency tablethe difference between categorical and numerical datahow to interpret data using different types of line plots to answer questionshow to read a scaled line plotThis resource includes:a 10 minute video lesson (YouTube and Loom viewing opt
Subjects:
Grades:
3rd - 5th
Types:
Also included in: DIGITAL Interpreting Data Interactive Lesson Bundle for Google Classroom
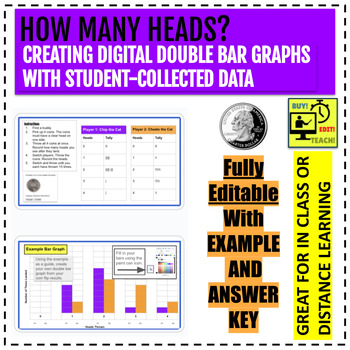
Creating Digital Double Bar Graphs with Collected Data (Fully Editable/Answers)
This dynamic digital resource, an editable Google Slide set, empowers students in streamlined data representation and analysis. Explore the creation of double bar graphs, summarizing experiment results, and comparing theoretical expectations to outcomes.Fully editable and customizable for your class, this assignment is ideal for both in-class and online learning. This digital resource encourages students to delve into experimental probability by using student collected data. Learners will flip f
Subjects:
Grades:
3rd - 6th
Types:
Unit 5 – Questions can be asked and answered by collecting and intepreting data
Accompanying slides for the Stage 2 NSW Mathematics unit- Unit 5 – Questions can be asked and answered by collecting and interpreting data.Contains 124 slides with lesson steps and teacher notes.
Subjects:
Grades:
3rd - 4th

Probability with Skittles: Leveled Hands On Learning Activity Project
This Probability with Skittles project allows students to learn hands on with real candy. Using candy will increase student engagement. The assignment is also leveled into 3 levels. The first level practices simple, basic probability. The second level is simple probability but requires more thought. The last level 3 practices independent and dependent probability. The activity can be edited to the level of difficulty being assessed and for differentiated to individual students or small groups. T
Subjects:
Grades:
3rd - 9th
Types:

Probability Bundle *DIGITAL ACTIVITIES*
This probability bundle is perfect for teaching, reviewing or assessing probability! The activities included in this bundle are digital, and are PERFECT for distance learning! This bundle includes 3 differentiated Probability Google Forms, 20 Probability Spinners Digital Task cards, and 2 Google Slides Probability games. The descriptions for each product are included below! Probability Spinners Digital Task Cards Looking for a fun way for your students to review probability? These probability sp
Subjects:
Grades:
3rd - 5th
Types:
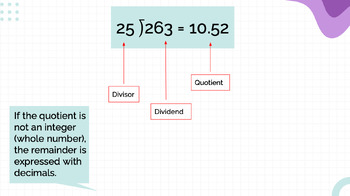
Order of Operations, Multiplying Decimals, Remainders, Graphs, Google Slides
Google Slides for different math topics: - Order of Operations (examples, breakdown of order) - Multiplying Decimals (Step by step guide and examples to practice)- Dividing Natural Numbers with a Decimal Remainder- Statistics (how to make a survey question, organize into data table, features of a graph, average problem)
Subjects:
Grades:
2nd - 8th
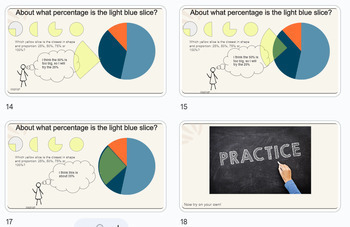
Estimating Percentages 2: Circle Graphs
This mathematics Slide Deck resource is intended to support learners working on Virginia Standard of Learning:6.NS.1 a)Estimate and determine the percent represented by a given model (e.g., number line, picture, verbal description), including percents greater than 100% and less than 1%. This material was development for 1:1 review and tutoring. Teachers may find it useful for younger learners and students receiving special/exceptional education as well as with students learning in states other
Subjects:
Grades:
3rd - 6th
CCSS:

STEM-ersion - Bar Graphs Printable & Digital Activity - Wildlife Ranger
STEM-ersion assignments aim to immerse students in an authentic application within a STEM career. This STEM-ersion focuses on bar graphs. Students often ask what careers will use certain math skills and I think this is an opportunity to show them where the thinking is used! These problems aim to help students construct responses with my Evidence - Analysis - Conclusion framework that I use in all of my classes. These questions are carefully crafted not to have one correct answer, but to require
Subjects:
Grades:
3rd - 8th
Types:
CCSS:
Also included in: STEMersion - PRE-ALGEBRA BUNDLE - Printable & Digital Activities
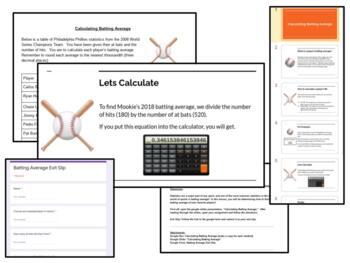
Calculating Batting Average: Math in Sports
Batting Average is a major statistic in the sports world, and this lesson pack will teach students to calculate it. Students will use calculator skills as well as rounding and place value skills. This lesson pack includes a google slides presentation, follow up google doc activity, and a google form to use as an exit slip. As a bonus, a google doc organization document is included to explain how to use each resource as well as a lesson description that can be included right into google classr
Subjects:
Grades:
2nd - 8th
Types:
Also included in: Math in Sports Bundle
Showing 1-24 of 49 results


