4 results
3rd grade statistics handouts for Google Apps
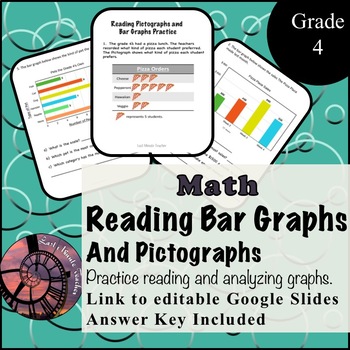
Reading Bar Graphs and Pictographs
Students struggling to read and analyze graphs?Here are over 10 pages of practice with bar graphs and pictographs.There are horizontal and vertical bar graphs for students to practice with, as well as many colourful pictographs.Designed to be used with the Grade 4 Math Makes Sense textbook, but also great practice for higher and lower levels.Studying from home?Not a problem!The zipped file includes an editable version using Powerpoint to share with students as well as a link to the Google Slides
Subjects:
Grades:
2nd - 6th
Types:

Pizza Statistical Investigation
Ready made, easy to follow statistical investigation. Easy to change so it suits whatever you want to investigate.
Subjects:
Grades:
2nd - 4th
Types:
Mean, Median, Mode - Google Slides
These are slides to teach your students what mean, median and mode are. I use these slides during my data management unit. I have included a page for guided practice.
Subjects:
Grades:
3rd - 8th, Staff
Types:
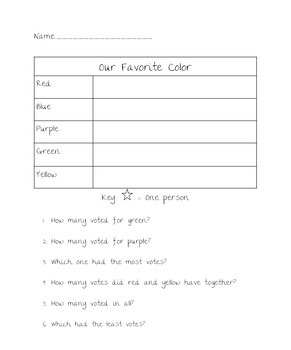
Favorite Color Pictograph
This is a blank "favorite color" pictograph to be filled out as a whole class survey activity with questions to answer at the bottom.
Subjects:
Grades:
K - 3rd
Types:
CCSS:
Showing 1-4 of 4 results


