121 results
Statistics graphic organizers for homeschool
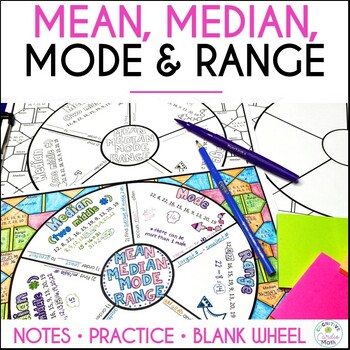
Mean, Median, Mode, Range Math Doodle Wheel | Notes and Practice Activity
Use this mean, median, mode, range doodle math wheel for notes and practice. Introduce each data measurement type as you teach it, or, you can use the math wheel to review all of them at once.What is a math wheel? A math wheel is a type of graphic organizer where students can:Take notes/guided notes inside the math wheelUse color, drawing, and doodling to help create memory triggersComplete practice problems in the pattern around the wheel, andColor the background patternStudents can keep these
Subjects:
Grades:
4th - 6th
Also included in: Mean, Median, Mode, Range Activity Bundle Math Centers
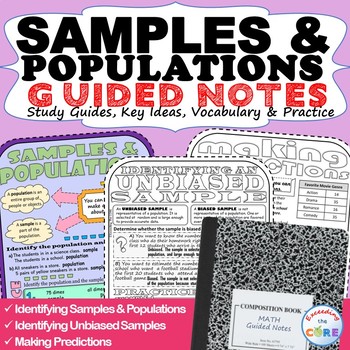
SAMPLES & POPULATIONS Doodle Math - Interactive Notebooks (Guided Notes)
- Great for online learning and distance learning!Have your students use these SAMPLES & POPULATIONS Guided Notes to review key ideas and essential vocabulary . Guided Notes aid in student focus, concept retention, engagement and creativity. Using this resource will allow students to synthesize this math concept and create their own tangible connections in their notes. Guided Notes Includes:__ Key Ideas with Verbal & Numerical Examples__ Essential Vocabulary with Definitions__ Skills Pr
Subjects:
Grades:
6th - 8th
Also included in: 7th GRADE MATH Assessments, Warm-Ups, Task Cards, Worksheets BUNDLE
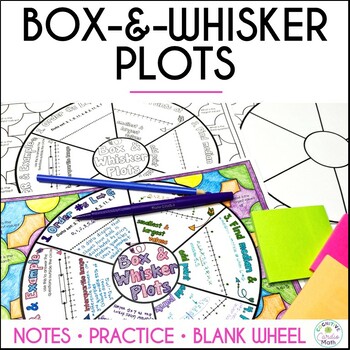
Box and Whisker Plots Doodle Math Wheel | Box Plots Guided Notes and Practice
Box and whisker plots just got more engaging! Use this math wheel to introduce (or review) and practice reading box and whisker plots. Students can keep this graphic organizer in their notebooks as a resource/study tool.The sections of the wheel include the steps to create a box-and-whisker plot and an example section:1) Order #s from least to greatest2) Place points at smallest and largest values3) Find the median; add point4) Find the 1st and 3rd quartiles; add points 5) Draw box and whiskers6
Subjects:
Grades:
6th
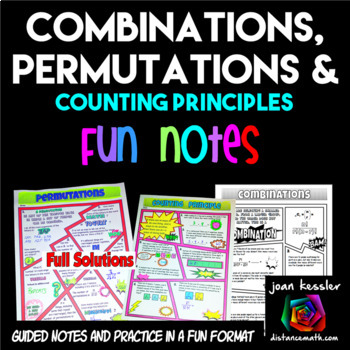
Permutations Combinations and Counting Principle FUN Notes Doodle Pages
Your students will love this Permutations, Combinations, and Counting Principle Fun Notes and Practice resource. Use it in class or as homework, assessment, or enrichment. A fun and engaging format for your students to learn the rules and practice their skills! Great for Algebra and Statistics.This resource contains 3 pages, one each for Permutations, Combinations, and the Fundamental Counting Principle. Students will complete a definitions and formula sections and complete over 20 problems.
Subjects:
Grades:
10th - 12th
CCSS:
Also included in: Algebra 2 FUN Notes Doodle Pages and Practice Bundle
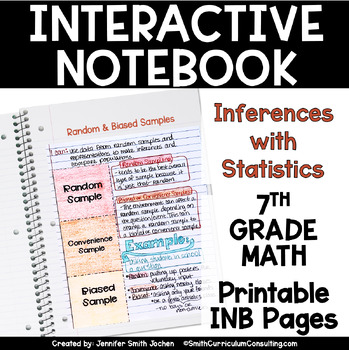
7th Grade Math Inferences & Statistics Interactive Notebook Unit TEKS PRINTABLE
Inferences with Statistics is an extensive unit to allow students to further their understanding of data and understanding how to decipher the statistics that follow along. Breaking down how to interpret the data and analyze it to allow it to be discerned is an important lesson as they continue through their math career. This Inferences with Statistics unit contains 10 unique lessons that have been tried and tested since 2012 inside and outside my own personal classroom. The interactive and kine
Subjects:
Grades:
7th
Also included in: Middle School Math Interactive Notebook Bundle - 6th 7th 8th TEKS CCSS
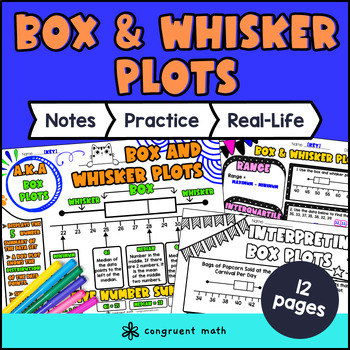
Box and Whisker Plots Guided Notes w/ Doodles | Data & Statistics | Sketch Notes
Introduce the box and whisker plot, or box plot, with this 14-page self-contained lesson packet! It includes guided notes with doodles, a color by number activity, an in-class practice problems sheet, a maze, and real-life applications. It works well as a formal lesson, graphic organizer, scaffolded notes, or interactive notebooks. This item is part of the Ultimate Box & Whisker Plot Bundle (print + digital).What’s included… (14 pages total)⭐ Guided Notes (4 pages): how to construct and inte
Subjects:
Grades:
6th
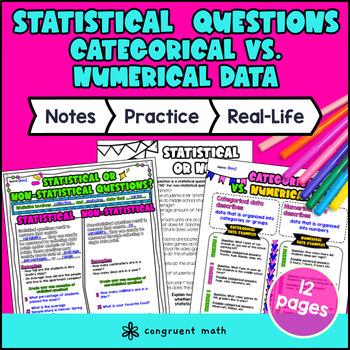
Statistical Questions Guided Notes | Categorical and Numerical Data
Introduce the statistical questions vs. non statistical questions, categorical data, and numerical data with this 12-page packet of self-contained lessons for your 6th grade math students! It includes guided notes with doodles (sketch notes) to introduce the new vocabularies, a color-by-number activity, an in-class practice problems sheet, and a real-life application. This lesson works well as a formal lesson, graphic organizer, scaffolded notes, or interactive notebooks for the statistics unit
Subjects:
Grades:
5th - 6th
CCSS:
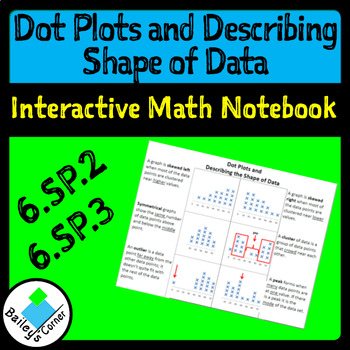
Dot Plots and Describing the Shape of Data for interactive notebook
This printable foldable includes pictures and definitions of dot plots including skewed left, skewed right, symmetrical, cluster, outlier, peak, and gap. Print two-sided, flip on short side. Competed version and version with blanks provided. 6.SP.2 and 6.SP.3
Don't forget to rate me to earn your TPT credits and follow me to be the first to see my new products and discounts. Contact me with any questions! :)
Visit my store to see my other products.
Like me on Facebook.
Follow me on Pinterest.
Ch
Subjects:
Grades:
6th
Also included in: Unit 7 Bundle: Statistics
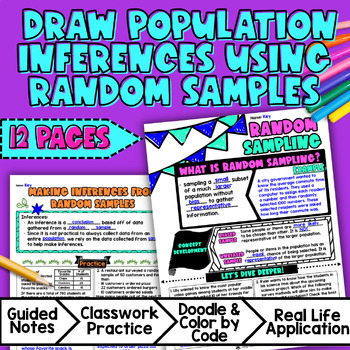
Population Inferences with Random Samples Guided Notes | 7th Grade Statistics
Introduce random sampling and inferences about population with this 12-page packet of self-contained lessons! It includes guided notes with doodles, practice page, color-by-number activity, maze, and a real-life application. This lesson works well as a formal lesson, graphic organizer, scaffolded notes, or interactive notebooks.Standards covered...✅ 7.SP.A.1 Understand that statistics can be used to gain information about a population by examining a sample of the population; generalizations abou
Subjects:
Grades:
7th
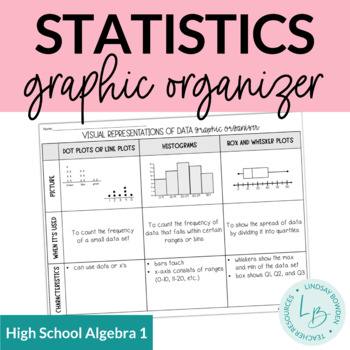
Statistics Graphic Organizer
This statistics graphic organizer compares histograms, dot plots, and box and whisker plots. I included 3 options so you can fill them in together as a class or just give as a handout. Perfect for an interactive notebook!You may also like:Box and Whisker Plots Notes & WorksheetsHistograms Notes & WorksheetsTerms of Use:This product should only be used by the teacher who purchased it. This product is not to be shared with other teachers. Please buy the correct number of licenses if this i
Subjects:
Grades:
8th - 10th
CCSS:
Also included in: Statistics Unit Bundle
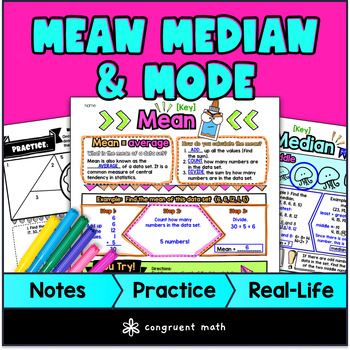
Mean Median Mode Guided Notes & Doodles | Measures of Central Tendency
Introduce and teach mean, median, mode with this 12-page packet of self-contained lesson! Includes guided notes with doodles, doodle math (similar to color by number activity), practice problems, maze, and real life application for measures of central tendency. It works well as guided notes, graphic organizer, scaffolded notes, and interactive notebooks. Students are exposed to relevant vocabularies such as average, middle, most frequent, and read about how mean, median, and mode is used in bas
Subjects:
Grades:
6th - 7th
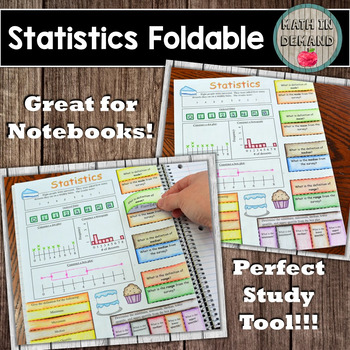
Statistics Foldable
Included is a foldable on statistics: mode, mean, median, range, minimum, maximum, upper quartile, and lower quartile. This is a great activity for any grade learning about statistics especially 6th and 7th grade. Students will love creating these foldables and it gives them a great tool to use to study!
Students will create a foldable then answer questions on the foldable. Students will construct a dot plot, histogram, and box plot. In addition, students will be giving the definitions and
Subjects:
Grades:
5th - 8th
Also included in: Math Foldables Bundle (Includes All Math Wheel Foldables)
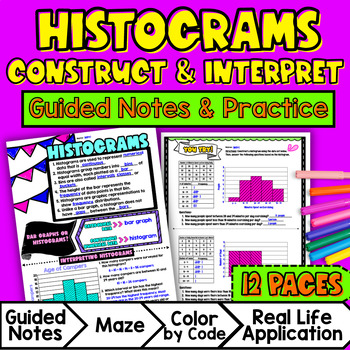
Histograms Guided Notes w/ Doodles | Numerical Data | Data & Statistics Sketch
Introduce the creating and analyzing histograms with this 12-page packet of self-contained lessons! It includes guided notes with doodles, practice page, color-by-number activity, maze, and a real-life application. This lesson works well as a formal lesson, graphic organizer, scaffolded notes, or interactive notebooks.Standards covered...✅ 6.SP.B.4 Display numerical data in plots on a number line, including dot plots, histograms, and box plots.✅ 6.SP.B.5 Summarize numerical data sets in relation
Subjects:
Grades:
6th
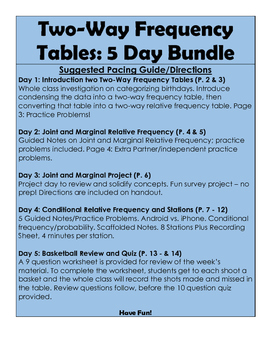
Two-Way Frequency Tables BUNDLE: 5 days - no prep!
This 5 day bundle introduces two way frequency tables, joint and marginal relative frequency, as well as conditional relative frequency. Guided notes, practice problems, and a project is included. The notes are scaffolded and the practice problems help students to solidify the concepts. Stations and a review activity is also provided, as well as a 10 question quiz. A pacing guide is given, but you may also reorganize the lessons if you please. This thorough 5-day bundle helps students to access
Subjects:
Grades:
8th - 9th
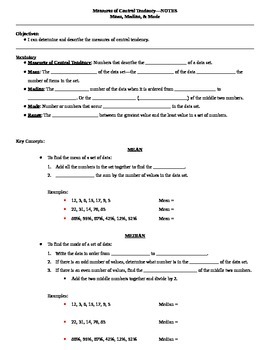
Measures of Central Tendency Guided Notes
These are guided notes for a lesson on measures of central tendency including mean, median, mode, and range. There are several examples in the notes and the same data sets are used to show each measure of central tendency.I have also included a teacher key to show you what to fill in the blanks as your students follow along.To use these notes, I simply projected them onto my whiteboard, gave the students their blank copies, and had them follow along and write what I wrote. This works great when
Subjects:
Grades:
5th - 12th
CCSS:
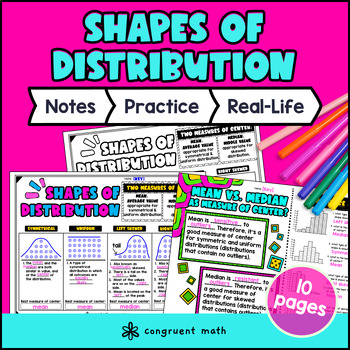
Shapes of Distribution Guided Notes | Symmetrical, Uniform, Skewed
Introduce the shapes of distributions, including symmetrical, uniform, left-skewed, right-skewed distributions, as well as appropriate measures of centers with this 10-page packet of self-contained lessons! It includes guided notes with doodles, a color-by-number activity, an in-class practice problems sheet, and a real-life application. This lesson works well as a formal lesson, graphic organizer, scaffolded notes, or interactive notebooks.Students learn through visual notes and practice proble
Subjects:
Grades:
6th
CCSS:
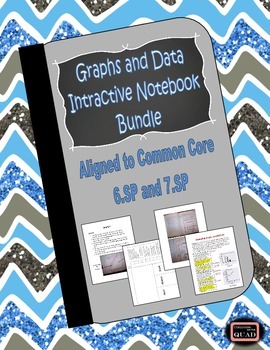
Graphs and Data Interactive Notebook Lessons {6.SP and 7.SP}
Looking for step by step instructions for interactive notebooking using data and graphs? This file is exactly what you need! There are complete instructions for notebook organization and how students use a self assessment stop light graphic organizer to communicate their comprehension of the lesson. For each lesson, there are complete instructions, student foldables to make the entries completely interactive, and pictures of sample pages. Each lesson also contains data to use with the foldables.
Subjects:
Grades:
4th - 7th
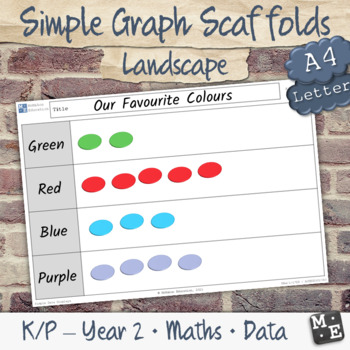
GRAPHING DATA Simple Picture Column Bar Graph Blank Scaffolds (Landscape)
Introduce students to arranging and representing data in rows or columns, with these printable graph scaffolds.By using these scaffolds students will:Use concrete materials, pictures or drawings as symbols to create data displays with one-to-one correspondenceGroup objects according to certain characteristicsArrange objects in rows or columns to form data displaysInterpret information presented on each data displayThis resource contains blank, A4/letter size scaffolds in landscape orientations:2
Subjects:
Grades:
K - 2nd
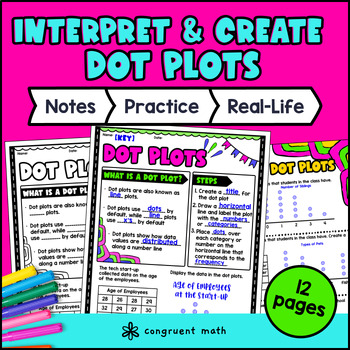
Construct & Interpret Dot Plots Guided Notes | Data & Statistics Color by Number
Introduce constructing and interpreting dot plots (line plots) with this 14-page packet of self-contained lesson! Includes guided notes with doodles, color by number activity, in class practice problems sheet, and real life application. It works well as a formal lesson, graphic organizer, scaffolded notes, or interactive notebooks. What's included... (12 pages total)✅ Guided Notes (3 pages).What is a dot plot?How to construct a dox plot from a data setHow to interpret a dot plot✅ Maze (1 page)
Subjects:
Grades:
6th
Choosing the Best Measure of Center
NO PREP LESSON!These amazing guided notes will help your students on all ability levels build on their understanding of mean, median, and mode. This is an extension lesson to apply mean, median, and mode to a real-world situation.Included sections are vocabulary, an activity, steps to solve, and examples including word problems. An answer key is included.This guided note will take approximately 45 minutes to teach.
Subjects:
Grades:
5th - 8th

Normal Distribution Foldable Popup
This is a popup of a normal distribution graph, showing students the probable spread of data within 1, 2, 3, and 4 standard deviations of the mean. The formulas for the population standard deviation and the sample standard deviation are both included. It is a great reference/graphic organizer for student notebooks and I have even had students who weren't in my class ask to join because they wanted this popup too. Useful for math or maths class, great for visual and kinesthetic learners, and
Subjects:
Grades:
9th - 12th, Higher Education, Adult Education
CCSS:
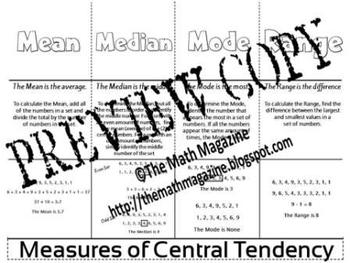
Measures of Central Tendency Mean Median Mode Foldable 6.SP.A.1, 7.SP.1, S-ID.2
Measures of Central Tendency Mean Median Mode Foldable 6.SP.A.1-3, 7.SP.1-4, S-ID.2
This is a single page PDF foldable that explains the Measures of Central Tendency: Mean, Median, Mode and Range.
The foldable includes: the definition of each term, an explanation of the correct ways to determine each and an example of each.
The folding directions are included with the purchased file.
BONUS: (2) FREE ITEMS are included as my way of thanking you for your interest in my items.
Follow me on T
Grades:
5th - 12th, Adult Education
IQR & MAD Guided Notes - Multiple Lessons
NO PREP LESSON!These amazing guided notes will help your students on all ability levels develop a deep understanding of interquartile range (IQR) and mean absolute deviation (MAD), These are lessons that would be used to build on students' strong understanding of range and mean.These structured notes will help your students develop number sense and a deep understanding of this concept as you guide them through the notes. Students will learn by working through the concrete, representational, and
Subjects:
Grades:
5th - 8th
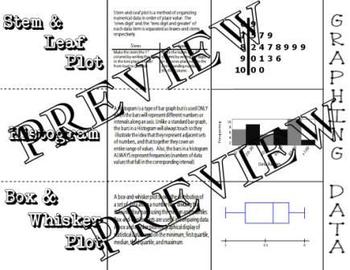
Graphing Data Histogram Box Whisker Stem Leaf Plot Foldable Interactive Notebook
Graphing Data Histogram Box Whisker Stem Leaf Plot Foldable Interactive Notebook
This is a single page PDF foldable that explains the differences in Histograms, Box and Whisker Plots and Stem and Leaf Plots, as well as shows an example of each.
The folding directions are included.
All feedback is welcomed
Follow Me on TpT!
Subjects:
Grades:
4th - 12th, Adult Education
Showing 1-24 of 121 results


