7th Grade Math Inferences & Statistics Interactive Notebook Unit TEKS PRINTABLE
- PDF
Also included in
- This MEGA Bundle contains lessons for an Interactive Notebook for 6th, 7th and 8th Grade Math. This Ultimate Bundle not only provides the Flippables (foldable activities) but also items necessary to complete your Interactive Notebook (INB) lessons as well as an online photo gallery for each of the gPrice $169.99Original Price $248.00Save $78.01
- Are you a teacher who teaches a looped class, homeschool co-op or maybe just have students at different levels? This Bundle is perfect for you and contains lessons for an Interactive Notebook for Fifth, Sixth and Seventh Grades. This Bundle Includes:(TIP: Click each link for more details for the indPrice $159.99Original Price $229.00Save $69.01
- This Bundle contains lessons for an Interactive Notebook for Seventh Grade Math, Eighth Grade Math, and Algebra for each of the Common Core Standards (CCSS), Texas Essential Knowledge and Skills (TEKS), and Oklahoma Academic Standards (OAS). This bundle of units not only provides the Flippables (folPrice $165.99Original Price $236.50Save $70.51
- If you are looking to cover all of the grades that you teach or that your teachers cover at your school then this is the bundle for you. Within this, there are all of the Interactive Notebooks from Kindergarten to Eighth Grade including Algebra. *************************→ Did you know that you canPrice $381.99Original Price $548.47Save $166.48
- This Bundle contains lessons for an Interactive Notebook for 7th Grade Math for each of the Common Core Standards as well as Texas Essential Knowledge and Skills (TEKS). This unit not only provides the Flippables (foldable activities) but also items necessary to complete your INB lessons and FULL CPrice $64.99Original Price $92.00Save $27.01
Description
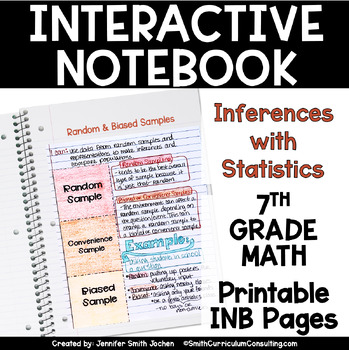
Inferences with Statistics is an extensive unit to allow students to further their understanding of data and understanding how to decipher the statistics that follow along. Breaking down how to interpret the data and analyze it to allow it to be discerned is an important lesson as they continue through their math career.
This Inferences with Statistics unit contains 10 unique lessons that have been tried and tested since 2012 inside and outside my own personal classroom. The interactive and kinesthetic component of cutting and gluing into an Interactive Notebook makes working with flippables more of a game-like activity which keeps students engaged in the lesson being presented.
This Seventh Grade Math Interactive Notebook provides alignment documents, teacher info pages for guided instruction (including the objective, vocabulary, standards, and directions), example photos, and all of the printable components for the lessons within The Statistics and Probability domain.
Use the LOW-PREP interactive notebook lessons to introduce and teach each math topic. Use the companion output/reflection to check for understanding. Students will use their interactive notebooks throughout the year as a valuable reference resource. Everything they learn remains in their notebooks for easy access and teaches students to Work Smarter, Not Harder!
This Interactive Notebook Unit Includes:
- Vocabulary Frayer Models for Unit Vocabulary
- Teacher Directions for each Interactive Notebook Activity
- Suggestions for Right Side (Output) Activities and/or Reflection Activities for each lesson
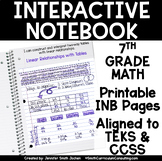
- Pictures of Flippables and/or INB Lesson in action
Concepts Included Are:
- Solving Problems with Dot Plots
- Solving Problems with Bar Graphs
- Solving Problems with Circle Graphs
- Mean, Median, Mode, and Range
- Compare Data in Dot Plots
- Compare Data in Box Plots and Determining Interquartile Range
- Random and Biased Samples
- Inferences from Random Samples
- Mean Absolute Deviation
- Comparing Populations and Drawing Conclusions on Population Activity
= 10 Total Interactive Notebook Lessons for $1 each
**Looking to save 30% on the FULL YEAR? Check out the Seventh Grade Math Interactive Notebook here!**
Check out the Other Interactive Notebook Units:
- 7th Grade Operations with Rational Numbers
- 7th Grade Expressions, Equations and Inequalities
- 7th Grade Ratios and Proportional Reasoning
- 7th Grade Inferences with Statistics
- 7th Grade Geometry
- 7th Grade Probability
- 7th Grade Linear Relationships
- 7th Grade Financial Literacy
→ Click here to visit my teaching blog, Smith Curriculum and Consulting
→ Did you know that you can get CREDITS for future purchases by leaving feedback on each of your purchases? Simply navigate to the My Purchases page and next to each download, you will be able to leave a star rating and comments about the activities you have purchased. I genuinely value your feedback and consider each and every word left.
→ Please email me here with any questions or comments.
Personal Copyright: The purchase of this product allows you to use these activities in your personal classroom for your students. You may continue to use them each year but you may not share the activities with other teachers unless additional licenses are purchased. The license for this purchase is NON-TRANSFERABLE. Site and District Licenses are also available.
Copyright © Smith Curriculum and Consulting, Inc. All rights reserved.
DISCLAIMER: With the purchase of this file you understand that this file is not editable in any way. You will not be able to manipulate the lessons and/or activities inside to change numbers and/or words.


