15 results
High school statistics resources by TpT sellers for TpT sellers

Which Quarterback is the G.O.A.T.? - Using Statistical Calculations
Note: This is an upgraded version of the Statistical Analysis Using Football (QB) Stats. If you have previously purchased this resource please email me and I will send you the updated version.This project has students calculate percents, averages, and ratios, as well as create scatterplots, box and whisker plots, and histogram (bar graphs) based on their calculations.Google slideshow includes 12 well know Hall of Fame quarterbacks including Joe Namath, Roger Staubach, Terry Bradshaw, Joe Montana
Subjects:
Grades:
6th - 9th
CCSS:
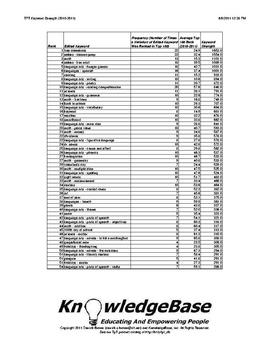
TPT KeyWord Strength Index (2010-2011) - Downloadable Spreadsheet!
What are the strongest keywords on TpT?
1. free downloads
2. Deanna Jump
3. math
Neither #1 nor #2 are surprises, but #3 (math) was certainly a surprise to me!
This report analyzes TpT's 2010-2011 keywords using a measure called "keyword strength".
The measure is based on a keyword's average rank, as well as the number of times it appeared in the 2010-2011 "Top 100" TpT search engine rankings.
This can be a valuable tool to help sellers understand TpT's marketplace supply and demand!
The P
Subjects:
Grades:
PreK - 12th, Higher Education, Adult Education, Staff
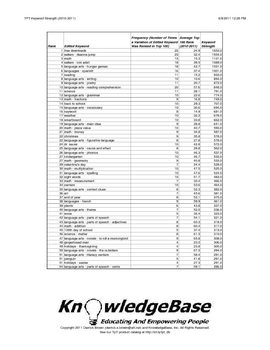
TPT KeyWord Strength Index (2010-2011) - Downloadable PDF!
What are the strongest keywords on TpT?
1. free downloads
2. Deanna Jump
3. math
Neither #1 nor #2 are surprises, but #3 (math) was certainly a surprise to me!
This report analyzes TpT's 2010-2011 keywords using a measure called "keyword strength".
The measure is based on a keyword's average rank, as well as the number of times it appeared in the 2010-2011 "Top 100" TpT search engine rankings.
This can be a valuable tool to help sellers understand TpT's marketplace supply and demand!
The P
Subjects:
Grades:
PreK - 12th, Higher Education, Adult Education, Staff
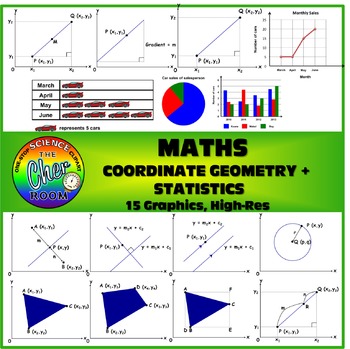
MATH Clipart: Coordinate Geometry and Statistics
15 Graphics on Coordinate Geometry and Statistics
You'll find diagrams that illustrates the following:
Gradient
Mid Point
Point at a ratio
Area of geometry
pi chart
pictogram
bar chart
line graph
This product is allowed for both personal and commercial use, but credit must be given to my store: https://www.teacherspayteachers.com/Store/The-Cher-Room
Subjects:
Grades:
7th - 12th
Dice Bulletin Board Letters
These dice themed alphabet letter will brighten up your bulletin board display. All 26 alphabet letters are included in an uppercase font, as well as numerals 0-9 and punctuation. Letters are approximately 6 inches tall. Just print what you need and enjoy. Be sure to check out my other fun, themed letters in my store.
Subjects:
Grades:
PreK - 12th, Higher Education, Adult Education, Staff
Statistics Vocabulary TEKS Aligned
This product includes several vocabulary words for a statistics unit. There are three graphs that will be able to cut and match, along with definitions of vocabulary words.
This is aligned with the Texas TEKS
6.12B 6.12C 6.12D 6.13B
I hope this can be useful to you and your students!
Stop by my store for some free fonts!
S&S Designs
https//www.teacherspayteachers.com/Store/S-And-S-Designs
Subjects:
Grades:
6th - 9th
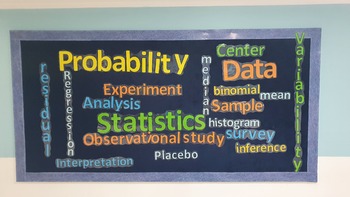
Statistics / AP Statistics Word Cloud Bulletin Board
The product is a word cloud for Statistics / AP Statistics.It is a PDF documents of the letters of different sizes forming the words shown in the bulletin board. ( few more words are in the document but not on the board). The colored used in the document are 5 named as color 1, color 2 .... at the bottom of the page. You can choose your own colors.For time saving, use a cricut or similar device if available.Best of luck!
Subjects:
Grades:
11th - 12th, Higher Education, Adult Education

MedAware Labels and Chart Kit Booklet
Always Know When, What, Why and How Medications are taken.
(Avoid under and overdosing prescription, generic and other drugs).
Subjects:
Grades:
PreK - 12th, Higher Education, Adult Education, Staff
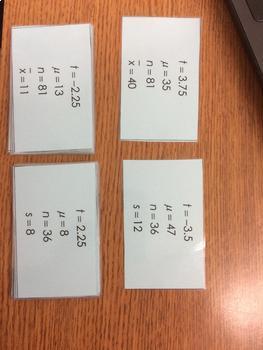
t-statistic "Find Your Match" Activity
PLEASE RATE! :) My Statistics students needed practice when they first learned how to calculate a t-statistic. I came up with this activity that requires students to work backwards using the t-statistic formula to either find the sample mean or the sample standard deviation.
Each student will have different numbers, but two of the cards will have the same sample mean and same sample standard deviation. Once the student solves for the missing statistic, they will walk around and find anothe
Subjects:
Grades:
11th - 12th
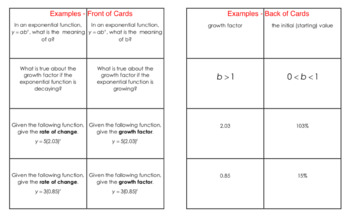
Exponential Models & Log Rules Activity
This activity allows students to quickly quiz one another (or even themselves) on exponential models and log rules. To be successful, students will need to know the meaning of each part of the exponential formula y=ab^x. Students will also need to be able to find the initial value, growth factor and growth rate from both an equation and a graph. Students will test their skills at converting a logarithmic equation to an exponential model and vice versa. There are a total of 32 different cards
Subjects:
Grades:
10th - 12th
CCSS:
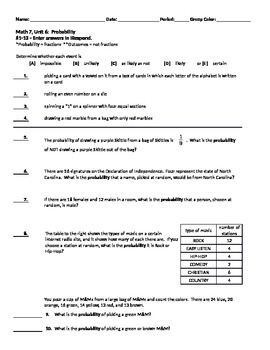
Probabilitiy Summative Test
Assesses Fundamental Counting Principle, Tree Diagrams, Independent & Dependent Events, and likelihood. Part One of the test is also iRespond/Promethean remote ready with multiple choice and numeric answers.
Subjects:
Grades:
6th - 9th

Expected Value Activity Involving Cereal Boxes Common Core
Students analyze a classic cereal box toy problem. The students are presented with a scenario about a collection of six toys in a cereal boxes and how long it would take to get each toy. Students simulate the experience by conducting an experiment in class.
Subjects:
Grades:
7th - 12th
CCSS:
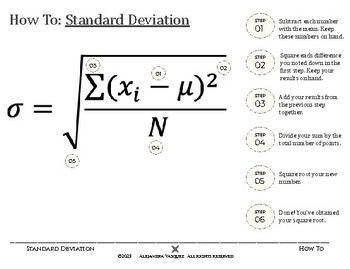
Standard Deviation Visual
Making math less intimidating, this visual lists the steps for standard deviation. The numbers correspond to the symbols on the formula. Free download!
Subjects:
Grades:
9th - 12th, Higher Education
CCSS:
Ohio Learning Standards (OLS) for Stats + 'I Can' Statements
Are you required to use the content standards on your lesson plans? And the 'I Can' statements? This product lists the 8 Mathematical Practices, an overview of the Statistics Learning Standards, and then the standards, each one accompanied by an 'I can' statement. The OLS are almost exactly the same as the Common Core State Standards, but for a little bit of the language and the notation. Oh, and this is FREE!
Grades:
10th - 12th
CCSS:
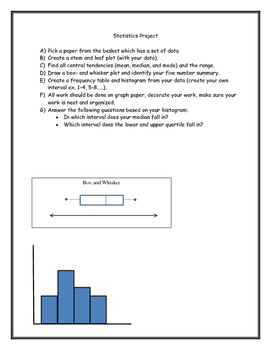
Statistcs Project
This project is designed for students to represent data in various statical representations.
Subjects:
Grades:
9th
Showing 1-15 of 15 results


