9 results
High school statistics resources for GATE
12 Days of Christmas: A Computer Spreadsheet Activity
This great holiday activity shows students how to use a computer spreadsheet to calculate the cost of their true love's gifts in today's dollars.The simple step-by-step procedure will allow both beginning and computer-savvy students to experience success as they learn how to use spreadsheet software. Students will enjoy the engaging and entertaining activity. No computer? No problem! Use the activity master so students can calculate the costs themselves.
Grades:
5th - 9th
Types:

Statistics Survey Project - Project Based Learning (PBL) with Math
Watch your students dive into the world of math as they create, execute, and analyze their own survey! Students will demonstrate mastery of data gathering, survey sampling, developing appropriate survey questions, data tables, Direct Variation, discrete graphs, dot plots, box and whisker graphs, and calculating the inter-quartile range.The Unique Survey Project is highly engaging, capitalizing on the innate curiosity of the adolescent mind. You will love the low-prep instructional guide. Your st
Subjects:
Grades:
6th - 10th
Types:
Also included in: Fun with Ratios Activities Bundle - 7th Grade PBL with Math
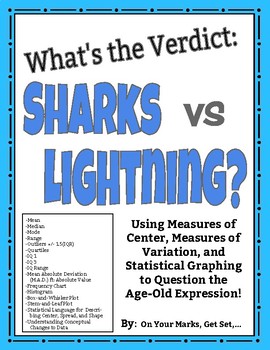
What's the Verdict: Sharks vs. Lightning? Modes of Center, Spread, and More!
Put it to the test! Use the age-old expression: "You are more likely to get struck by lightning than to be bitten by a shark!" to learn and practice Measures of Center, Measures of Spread, Measures of Shape, and Statistical Graphing including:MEANMEDIANMODERANGEOUTLIERS [Using IQR +/- 1.5(IQR)]QUARTILES [lower quartile (IQ-1) and upper quartile (IQ-3)]INTERQUARTILE RANGE (IQR)MEAN ABSOLUTE DEVIATION/ M.A.D. ft. ABSOLUTE VALUESYMMETRY/ASYMMETRY OF DISTRIBUTIONCLUSTERS AND GAPSBELL SHAPED CURVE AN
Subjects:
Grades:
5th - 12th, Higher Education, Adult Education
Types:
Fun with Ratios Activities Bundle - 7th Grade PBL with Math
The purpose of the Fun with Ratios Activities Bundle is to give students the opportunity to use creativity to apply ratios, proportions, and percentages in real-world settings. This bundle includes three unique tasks: Black Friday Mastery Task, Direct Variation Poster Mastery Task, and the Unique Survey Project. These activities and their accompanying materials are suited for students in grades 7 through 9. These lessons make excellent sub plans. Each project takes approximately two 60-minute bl
Subjects:
Grades:
7th - 9th
Types:
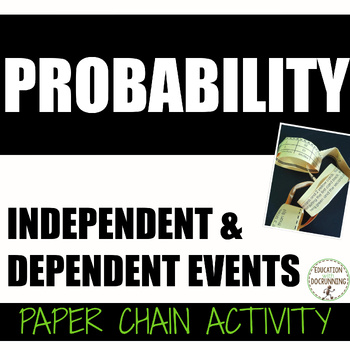
Probability Independent and Dependent Events Activity Paper Chain
Engage students at centers or in partners with this Probability Independent and Dependent Events Paper Chain Activity. Students solve probability questions involving tables, word problems, and diagrams. One link which leads to the answer on the next link. My students LOVE this activity. This resource includes:- Paper chain links with Probability problems- Answer key- Teacher's guide.A great addition to your middle school math curriculum and for differentiation.Also available in money-saving
Subjects:
Grades:
7th - 9th
Types:
CCSS:
Also included in: 7th Grade Math Activities Paper Chains Bundle
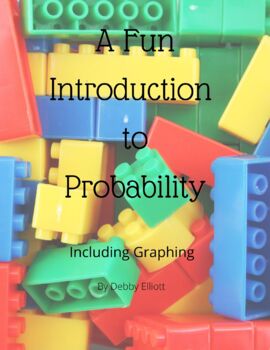
A Fun Introduction to Probability
This product contains fourteen pages that introduce probability by graphing the LEGOs and comparing the number of studs on LEGO bricks. These statistics will be figured in fractions, decimals and percentages. Graphing will be done on bar graphs and pie graphs. The worksheets are colorful and engaging for students. Students will learn to find the mean, median and mode of different numbers of studs on LEGO bricks. Students will find their own statistics and combine them with the statistics of ot
Subjects:
Grades:
4th - 9th
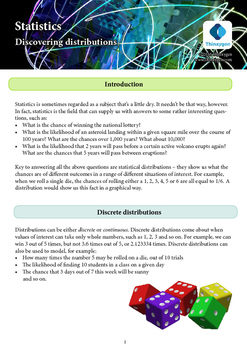
Statistics
A fun introduction to some of the most commonly-used statistical distributions, including the Normal, Binomial, Poisson and more. Great for budding scientists and mathematicians! Comes with activities, a quiz and answer guide.
Subjects:
Grades:
9th - 12th
Types:
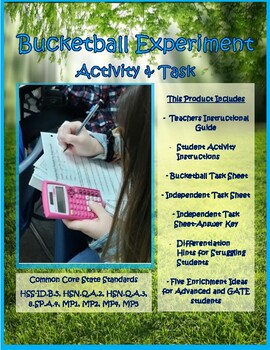
Bucketball Experiment Activity & Task
The Bucketball Experiment Activity & Task gives students an opportunity to practice gathering random data, organizing that data into a table, and then determining the relative frequency of the data in a context that is fun and personal. This activity/task has two parts. First students participate in the Bucketball Experiment Activity and record their raw data. Once that is completed and shared between teams, students will partner up to complete the second part, Bucketball Experiment Task. Th
Subjects:
Grades:
8th - 10th
Types:
CCSS:
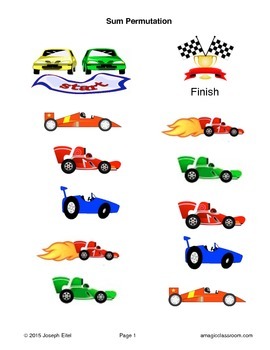
Sum Permutation
An introduction to basis permutations. Race cars with colors and numbers are used to introduce the concepts. 2 work pages start with a basic permutation. 2 more pages are bit more complex. The last work page is harder but the students are guided through it. A great magic effect ties it all together at the end.
Subjects:
Grades:
7th - 11th
Types:
Showing 1-9 of 9 results

