5 results
General science Common Core 3.MD.B.3 lessons
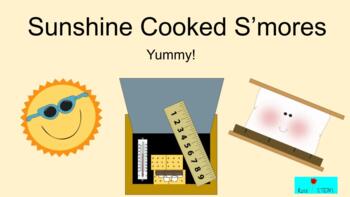
Construct Solar Oven S'Mores-Measure Heat Energy with Thermometers
Want a lesson that is laid out for you step by step on the smartboard and can be used in Google Classroom? Everything is laid out for you to say & do every step of the lesson! This is a guided lesson that will take you from start to finish as you teach your students all about using heat energy from the sun to cook yummy s'mores! Each slide takes you and your students step by step in engineering a solar oven. The slides include detailed pictures and photographs of the solar oven as your stude
Subjects:
Grades:
2nd - 5th
Types:
CCSS:
NGSS:
3-5-ETS1-3
, 3-5-ETS1-1
Temperature and Wind Chill: An Integrated Weather Activity
This engaging cooperative activity includes simulating a real life scenario to investigate the impact of wind and water on temperature. Math activities such as thermometer reading practice and making bar graphs are integrated within this activity.
Aligned to Next Generation and Common Core Standards.
Appropriate for grades 3-6.
Please leave feedback and earn TpT credits for future purchases.
If you like this download, you might also like these similar products:
Photosynthesis
Atomic Struc
Subjects:
Grades:
3rd - 6th
Types:
Also included in: Weather Super Bundle
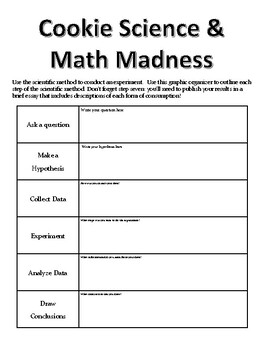
Cookie Science and Math Madness
My students really struggle with creating their own graphs as well as communicating in written form the data presented in a graph. This activity was actually inspired by a TV show about people sharing secrets over cookies and milk while discussing the various ways people eat Oreos. The activity is cross-curricular and involves students in the full writing process, as well as speaking, data collection, graphing, and drawing conclusions. My students really seem to enjoy this graphing activity more
Subjects:
Grades:
6th - 9th
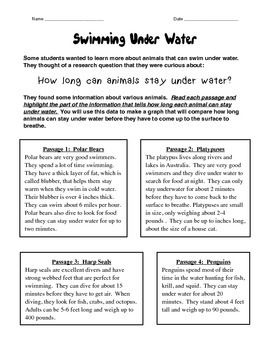
Swimming Under Water Graph
Combine nonfiction reading skills with research, math, and science! In this activity, students build upon previous graphing skills by reading through research to collect data and then using the data to create a graph. In previous activities, the data was collected for them and they had to make the graph based on that information. This activity takes them to the next level by having them search through 4 passages for information about how long polar bears, platypuses, harp seals, and penguins
Subjects:
Grades:
2nd - 4th
Types:
Animal Weight Graph
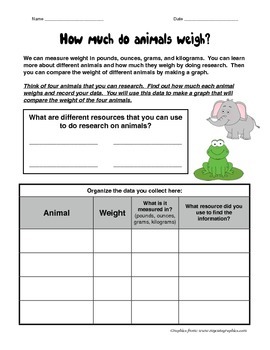
Combine nonfiction reading, research, math, and science in one activity! Students can use this document to plan research and collect data on the weights of four different animals. On the recording chart, they indicate what each animal's weight was measured in (pounds, ounces, grams, or kilograms), and from what source they got the information. They use the data that they collect to make a graph to compare the animals' weights. Finally they answer questions about the graph and even make a que
Subjects:
Grades:
3rd - 4th
Types:
Showing 1-5 of 5 results

