Cookie Science and Math Madness
- PDF
Description
My students really struggle with creating their own graphs as well as communicating in written form the data presented in a graph. This activity was actually inspired by a TV show about people sharing secrets over cookies and milk while discussing the various ways people eat Oreos. The activity is cross-curricular and involves students in the full writing process, as well as speaking, data collection, graphing, and drawing conclusions. My students really seem to enjoy this graphing activity more than others we have done...but of course, that may just be because they get to eat cookies!
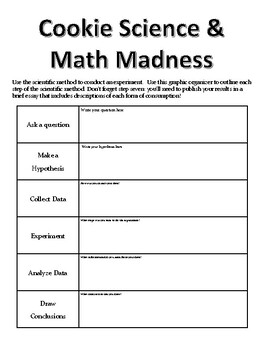
After I spent two weeks on the topic of the scientific method with my eighth graders, they could list the steps in order, but I felt they weren't fully grasping the underlying concepts. I decided to use this activity to help them utilize the scientific method and have included the graphic organizer we used. The survey became the experiment, the graphing of data became the analyzing of data, and they published their results by writing a short essay that included descriptions of the various methods of consumption.
By request of our math teacher, once again returned to this project and adjusted it. It seems that our students believed that 15 votes = 15%, even though they only had 57 votes total! Oops! Not very mathematically accurate. I created a graphic organizer to help them turn their data into fractions, then decimals, and finally, percentages. We then went back and added pie charts to our final projects. The graphic organizer we used is included.
One project + 3 happy teachers (ELA, math, science) = 1 very happy ESL teacher!
A Survey & Graphing Activity
1. Students will use the scientific method to conduct a qualitative investigation. A graphic organizer that can be used to write out each of the steps is included. A sample key (every group will vary) is also provided.
2. Have students brainstorm as many ways as possible to eat an Oreo. (Mine like to be inspired by trying them out as they list them!)
Extension: Have the students write short descriptions/directions for eating Oreos using each method. It lengthens the activity but is good descriptive and/or process writing practice.
3. Have students design a survey question and recording sheet to be used in gathering information. (A sample is provided and may be used to save time or accommodate lower language students).
4. Students conduct the survey among their peers, the school staff, and their families.
5. Student pairs then create a graph of the data, including title, labels, key, and any other information they feel is necessary.
Extension: This is a great opportunity to assess their understanding o graphs by noting what type of graph they choose to communicate their information and asking them why they made the choice they did.
Extension 2: After students create a bar graph, have them use the included graphic organizer to note their results as fractions, decimals, and percentages; they can then create pie charts.
6. This activity can be extended further by writing “reports” to summarize the results and point out key facts.


