6 results
7th grade statistics lessons for SMART Notebook
7th Grade CCSS Probability Unit Lessons
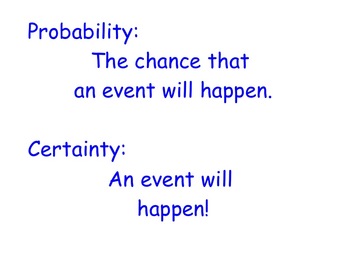
Complete 7th Grade CCSS Probability Unit Lessons.
This download includes all the lessons for the 7th grade probability unit and homework for each lesson. The entire lesson progression can be accessed for free on my site.
These lessons can be used independently or with video lessons that are available on my site. The video lessons are exceptionally useful with students that have been absent or are more advanced and need an independent study unit.
Subjects:
Grades:
6th - 8th
Data Lesson Sequence - 4 Lessons - Data/Statistics - KS2/Stage 3
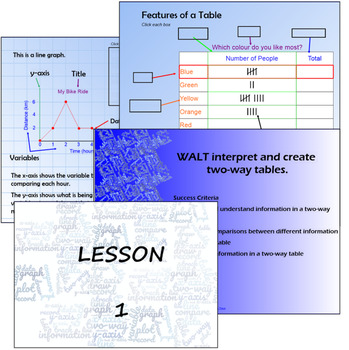
Data lessons on tables, two-way tables and line graphs presented in Smart Notebook. It includes 4 lesson presentations including WALTs and Success Criteria in the slides, all ready to be used with your class. It gives some basics for a unit of work on data and it is fully editable. The aim of these lessons is to break down each data collection/displaying method into simple language so that it is easy to follow.Lesson 1 - Simple Data Tables. This goes through the features of a table and practice
Subjects:
Grades:
4th - 7th
SMARTBOARD lesson on ratios, fractions, percentages, and more
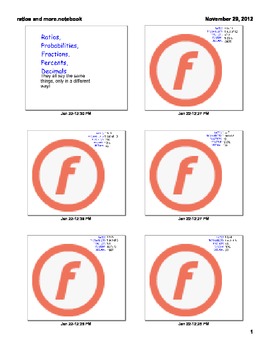
This smartboard lesson showcases how ratios, fractions, decimals, probabilities, and percentages are all similar ways of looking at the same thing. Each page has a spinner with a different amount of colored slices on it. As you go from many slices to fewer slices, the chance of correctly predicting what color comes up gets much better.
Have students 'bet' classroom rewards like tickets or candy to see who can correctly guess the most colors as you go through the lesson.
Subjects:
Grades:
3rd - 12th, Adult Education

Mean Absolute Deviation Lesson
This is a smartboard lesson on how to calculate the mean absolute deviation. The lesson is currently filled in, which you can erase, and has examples as well as bell work.
Subjects:
Grades:
6th - 9th
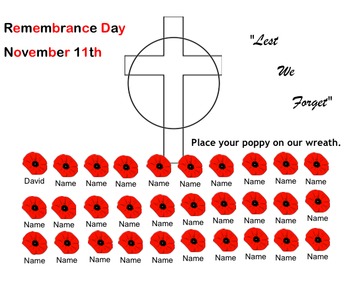
Remembrance Day Morning Activities for All Grades
This notebook is designed to aid teachers in the morning of Remembrance Day.
There are is a copy of Flanders Field. - Potential for Fluency Activity
Infographic on Remembrance Day - Potential for Numeracy/Literacy Discussion
Commercial from Bell - Potential Media Literacy Discussion
The Poppy Story for K-4 - General Knowledge
The Poppy Story for 5-8 - General Knowledge
With exception of the attendance, all are resources that I have used are not mine. The authors of these resources are to be c
Subjects:
Grades:
K - 8th
Types:
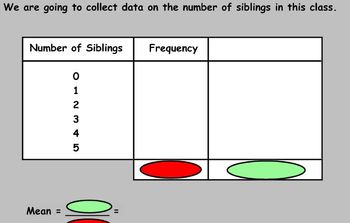
SmartNotebook Lesson - Calculating averages from a table
This notebook file can be used as an entire lesson to teach calculating averages from a table.
The first slide contains a starter asking students to find the mean, median and mode from sets of data. The second slide can be used to collect your own data in the class in order to show how to calculate the mean.
Following that there is another example, before finally showing two questions on the same slide which the students can work through.
Subjects:
Grades:
6th - 11th, Higher Education
Showing 1-6 of 6 results


