TPT
Total:
$0.00
Selected
36 results

Summer science Common Core 8.SP.A.1 resources
Preview of Analyzing and Interpreting Data and CER Worksheet Bundle NGSS Science Practices
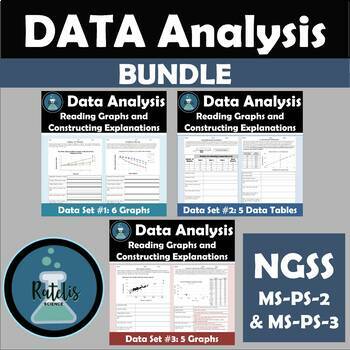
Analyzing and Interpreting Data and CER Worksheet Bundle NGSS Science Practices

Created by
Ratelis Science
Set of 17 worksheets with graphic organizer for helping students analyze data and use it to create a scientific explanation using NGSS Physical Science content with data sets on topics including motion, magnetism, sound, gravity, forces, and thermal energy. Supports lessons for NGSS Science and Engineering Practices of Analyzing and Interpreting Data, and Constructing Explanations.In the NGSS it is important that students work with larger sets of data and that they understand how to deal with th
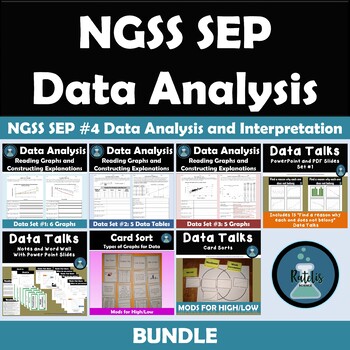
Preview of Data Analysis for NGSS Bundle Analyzing and Interpreting Graphs, Data Tables CER
Data Analysis for NGSS Bundle Analyzing and Interpreting Graphs, Data Tables CER

Created by
Ratelis Science
NGSS physical science requires students to practice analyzing and interpreting data and then using those observations to write scientific explanations in the Claims, Evidence, Reasoning, or CER format.This is a bundle of all my Data Analysis products that I use with my students in science class.Designed to support NGSS SEP #4 Data Analysis and InterpretationIncludes Warm Ups, Card Sorts, Data Worksheets with CER prompts, and Vocabulary Word Wall
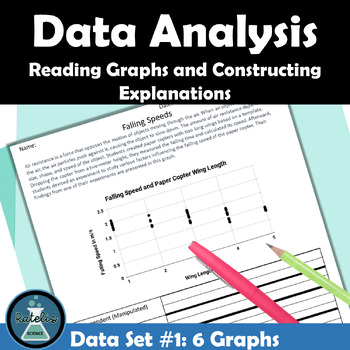
Preview of Analyzing and Interpreting Data Set #1 NGSS Reading Graphs and CER
Analyzing and Interpreting Data Set #1 NGSS Reading Graphs and CER

Created by
Ratelis Science
In the NGSS it is important that students work with larger sets of data and that they understand how to deal with the natural "messy" data that most scientists have to work with. These 6 prompts use NGSS physical science content related to motion, magnetism, and thermal energy. This is a low-prep worksheet that works great as homework, an independent station, or a bellringer. I have also included a graphic organizer for helping students analyze data and use it to create a scientific explanati
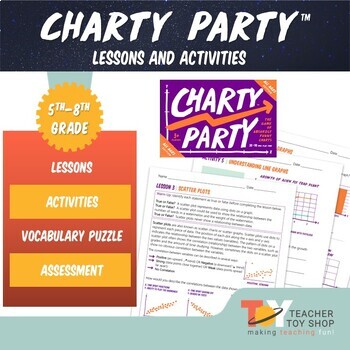
Preview of Graphing Lessons and Activities for Charty Party Game
Graphing Lessons and Activities for Charty Party Game

Created by
Teacher Toy Shop
Explore the engaging world of graphing with these Graphing Lessons and Activities for Charty Party Game, featuring nine interactive lessons that seamlessly blend learning with the excitement of a party game. Designed to teach line graphs, bar graphs, scatterplots, and more, these lessons are presented in kid-friendly language, making graphing concepts accessible and enjoyable for students. As they analyze graphs during the Charty Party™ game, students not only practice graphing but also delve in
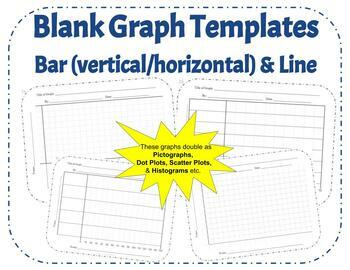
Preview of 42 Blank Graph Templates: Horizontal & Vertical Bar Graph, Line Graph, Printable
42 Blank Graph Templates: Horizontal & Vertical Bar Graph, Line Graph, Printable

Looking for an array of printable graph templates for all your future bar and line graph needs? Look no further! With 42 different templates ranging for bar graphs, to line graphs, varying in X values and Y values, this combination should be the last graph download you need to worry about for your class. These graphs can even be used as Histograms, Dot Plots, Scatter Plots, or a variety of other graphs to suit the needs of your classroom.I created this template to require all the basics of gr
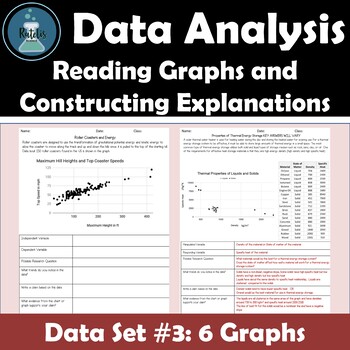
Preview of Analyzing and Interpreting Data Set #3 NGSS Interpreting Graphs and CER
Analyzing and Interpreting Data Set #3 NGSS Interpreting Graphs and CER

Created by
Ratelis Science
In the NGSS it is important that students work with larger sets of data and that they understand how to deal with the natural "messy" data that most scientists have to work with. These 6 prompts use NGSS physical science content related to motion, gravitational potential energy, kinetic energy, and thermal energy. This is a low-prep worksheet that works great as homework, an independent station, or a bellringer. I have also included a graphic organizer for helping students analyze data and use i
Preview of Guide to graphs: Pie charts, bar graphs, line graphs, scatterplots + activities
Guide to graphs: Pie charts, bar graphs, line graphs, scatterplots + activities

Created by
By Miss C
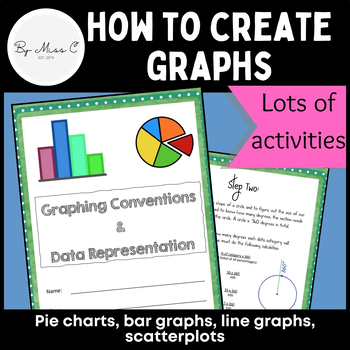
This is a fantastic resource for introducing students to graphing and data representation. This booklet will take students through the uses for particular graphs and how to construct them. At the end of each module, there are activities for students to complete, to practice their graphing skills. Answer key is included, making this a no-prep activity. This booklet covers: - why we visually represent data- pie charts and how to create them - bar graphs and how to create them - line graphs and how
Preview of 8th Grade ALL YEAR MATH PACKETS Bundle| COMMON CORE Assessment
8th Grade ALL YEAR MATH PACKETS Bundle| COMMON CORE Assessment

This 8th Grade Math ALL YEAR Math Packets BUNDLE has it all and requires NO PREP! The resources in this packet are designed to meet Common Core Standards for 8th-grade math.Description:This Math Packet BUNDLE includes 4 of my '8th Grade Math Packets' that can be used during the entire school year. There is a total of 160 skills practice and real-world problems in this bundle. Each of the packets includes skills practice questions and real-world problems for each of the 5 Common Core domains.
Preview of Analyzing and Interpreting Data Set #2 NGSS Reading Data Tables and CER
Analyzing and Interpreting Data Set #2 NGSS Reading Data Tables and CER

Created by
Ratelis Science
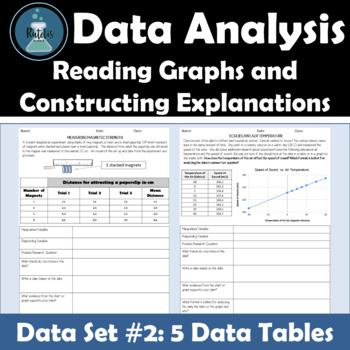
In the NGSS it is important that students work with larger sets of data and that they understand how to deal with the natural "messy" data that most scientists have to work with. These 5 prompts use NGSS physical science content related to magnetism, gravity, waves, and thermal energy. This is a low-prep worksheet that works great as homework, an independent station, or a bellringer. I have also included a graphic organizer for helping students analyze data and use it to create a scientific e
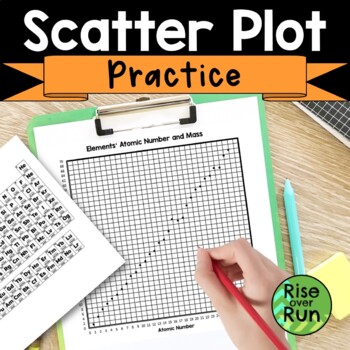
Preview of Scatter Plot Practice Worksheet

Scatter Plot Practice Worksheet

Created by
Rise over Run
In this practice activity, students graph points to represent elements' atomic number and mass. They create a scatter plot by graphing the points. This is a great way connect what they are learning in science! Students will need to reference the Periodic Table of Elements to complete their scatter plots. (One is provided to print if needed.)Once they create the scatter plot on the coordinate plane provided, they answer questions about the type of association and determine an equation to fit th
Preview of Black History Month Bell Ringer Slide Presentation: Scientist Edition
Black History Month Bell Ringer Slide Presentation: Scientist Edition

Created by
Longing 2 Learn
Embark on a transformative journey of discovery with our Black History Month Bell Ringer Slide Presentation - Scientist Edition! Elevate your classroom experience throughout February as you delve into the remarkable contributions of black scientists and their impact on the world of science. This engaging resource is designed to captivate students, fostering an inclusive and enlightening atmosphere.Key Features:Scientist of the Day:Explore the life and accomplishments of a different black scienti
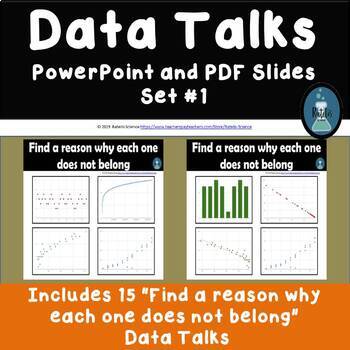
Preview of NGSS Analyzing and Interpreting Data Warm Ups Graphs with Odd One Out
NGSS Analyzing and Interpreting Data Warm Ups Graphs with Odd One Out

Created by
Ratelis Science
A set of 15 warm ups designed for NGSS SEP: Analyzing and Interpreting Data Students are challenged to figure out which graph does not belong using observations of trends in bi-variate data, scatter plots and other graphs. This product was developed and tested for use with an 8th grade science class so the data skills are also aligned with the 8th grade CCSS for the following math Statistics and Probability Standards CCSS.MATH.CONTENT.8.SP.A.1 and CCSS.MATH.CONTENT.8.SP.A.2This is a technique
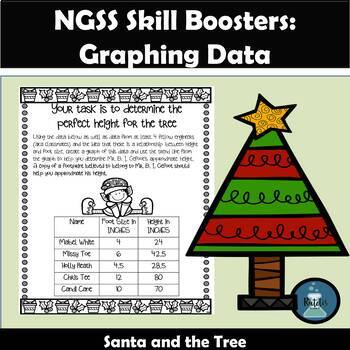
Preview of Holiday NGSS Science Review Graphing Scatter Plots and Finding Trend Lines
Holiday NGSS Science Review Graphing Scatter Plots and Finding Trend Lines

Created by
Ratelis Science
In this Winter Holiday or Christmas-themed activity for middle school science or math, students work collaboratively to graph the data they collect about foot length and height, and use the graphs they make to extrapolate and predict the required information about the height of the tree they need for the gift. Students practice measurements in either inches or centimeters, making a scatter plot graph, and finding the line of best fit. Set in the North Pole with Santa Claus and his Elves, studen
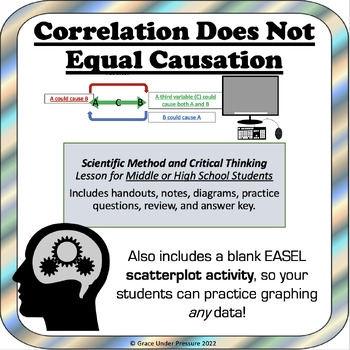
Preview of Correlation Does Not Equal Causation: Scientific Method & Critical Thinking
Correlation Does Not Equal Causation: Scientific Method & Critical Thinking

Scientific Method and Critical Thinking Lesson for Middle or High School Students: This printable booklet teaches students about correlation, scatterplots, correlation coefficients, third variables, true experiments, independent and dependent variables, random assignment and more in an easy-to-understand and engaging manner.12 different correlation examples are included. The package includes handouts, notes, diagrams, practice questions, a review, and an answer key.I have also included my blank
Preview of Scatter Plots and Data Analysis NGSS Boom Cards Digital Task Cards
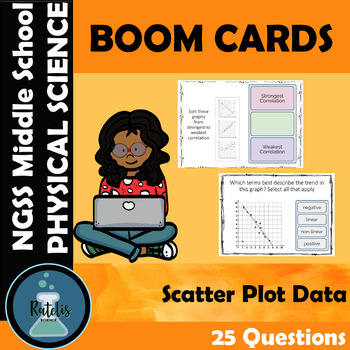
Scatter Plots and Data Analysis NGSS Boom Cards Digital Task Cards

Created by
Ratelis Science
This set of digital task cards covers trends in scatterplots for NGSS data analysis science skills.Topics in deck:Using scatterplot graphs, identify the following data trends: outlier, cluster, linear, non-linear, negative correlation, positive correlation, no correlation, cluster, strong correlation, and weak correlation.This Comprehensive Boom Card Deck contains more than 20 questions.  This means that students will have to complete multiple Boom Card Play sessions to see all the review questi
Preview of Analyzing and Interpreting Data NGSS Data Talks Lesson and Word Wall
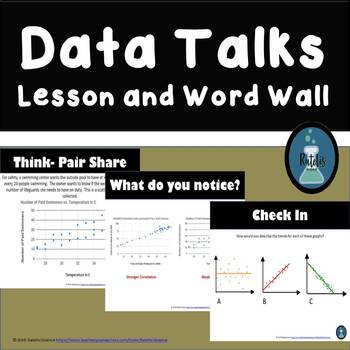
Analyzing and Interpreting Data NGSS Data Talks Lesson and Word Wall

Created by
Ratelis Science
Low Prep lesson and word wall for NGSS SEP Analyzing and Interpreting Data. I use it to help students connect background knowledge to new terms for data analysis in middle school science.This presentation is more student-driven in that we discuss what we are noticing and build class vocabulary around the data. We practice this with multiple graphs as the lesson builds and through warm-ups and discussing our results from labs done in class. So I let the students start out using what they already
Preview of Data Analysis Reading Graphs Sample

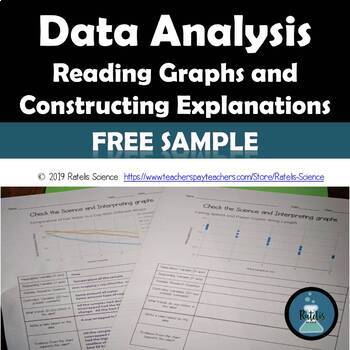
Data Analysis Reading Graphs Sample

Created by
Ratelis Science
Product DescriptionThis is a sample of the data analysis organizer I use for helping students analyze data and use that data to create a scientific explanation (claim, evidence and reasoning). I use this organizer with data from labs done by my classes. I collect the data in a spreadsheet and use it to make a larger data set for students to analyze as a weekly graphing practice. This also gives us the opportunity to talk about experimental design, trends in data and to work with larger data se
Preview of Graphing in Science: A Google Slides Lesson PLUS Guided Notes Handout!
Graphing in Science: A Google Slides Lesson PLUS Guided Notes Handout!

This EDITABLE Google slides (powerpoint) presentation AND guided notes handout covers all of the essential information students need to create and analyze graphs in science. This lesson is designed to refresh students on the concepts of creating graphs using scientific data, analyzing relationships between independent and dependent variables, and includes lots of examples and practice opportunities! This lesson can be used to introduce the important concepts of graphing in science, or it can be
Preview of Get Science Fair Ready! Project Based Learning Data Literacy for Middles School
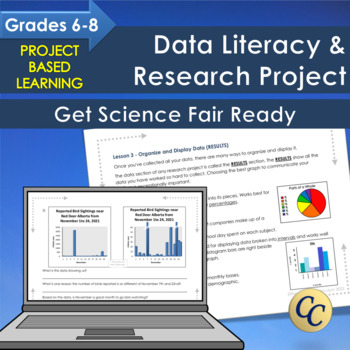
Get Science Fair Ready! Project Based Learning Data Literacy for Middles School

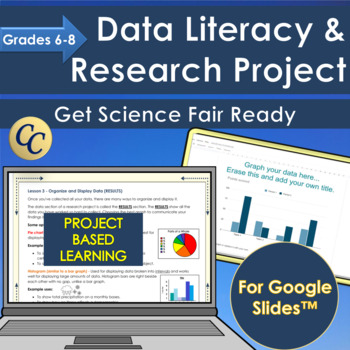
Science fair project that helps you teach data management, statistics and probability. Real data and meaningful science! The data literacy and research project covers everything middle school students need to know about collecting and interpreting data for their own animal observation observation project. Great for science fairs! Learn about collecting objective, non-bias data and how to recognize it in the real world. → Everything is included to have students learn about data, collect data and
Preview of Science Skills Bell Ringers

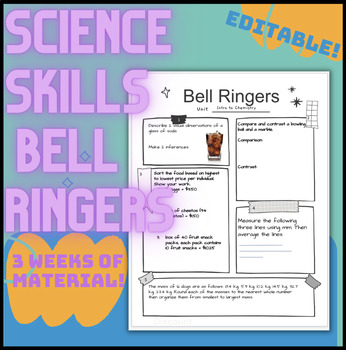
Science Skills Bell Ringers

3 weeks worth of bell ringers focused on basic science skills including determining variables, reading graphs and data tables, making observations and inferences, explaining your thinking, forming hypotheses, sorting information, averaging, measuring, compare and contrast, rounding data and creating a claim. Some questions are open ended and do not have a right/wrong answer, some do have correct answers. These bell ringers are best used with upper middle school through high school. Answer Key is
Preview of Drop Zone: Parachute Design Project-Based Learning Lab
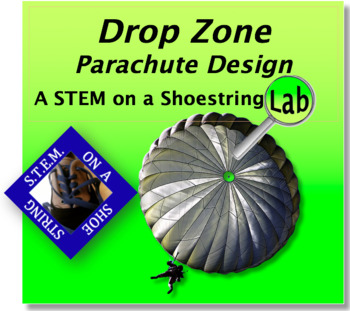
Drop Zone: Parachute Design Project-Based Learning Lab

This highly adaptable investigation will engage students of many ages and levels. Options for primary, upper elementary, and middle school are included. This is a true STEM lab that incorporates the science, technology engineering, and math components. Common, inexpensive, and easily available materials make this an easy lab to teach yet it produces maximum learning and engagement in your classroom. NGSS and Common Core Math Standards alignment are included in this "STEM on a Shoestring Budget"
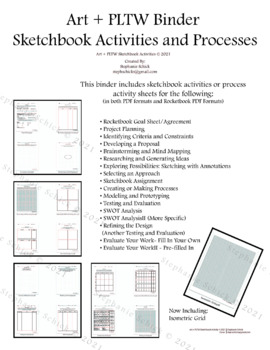
Preview of PLTW, Science and Art Processes and Activities Binder
PLTW, Science and Art Processes and Activities Binder

Created by
Winter Studios
Art + PLTW + Science BinderSketchbook Activities and ProcessesThis binder includes (in both PDF formats and Rocketbook PDF Formats) sketchbook activities or process activity sheets for the following:• Rocketbook Goal Sheet/Agreement• Project Planning• Identifying Criteria and Constraints• Developing a Proposal• Brainstorming and Mind Mapping• Researching and Generating Ideas• Exploring Possibilities: Sketching with Annotations• Selecting an Approach• Sketchbook Assignment• Creating or Making Pro
Preview of Fidget Spinners: Math in Motion

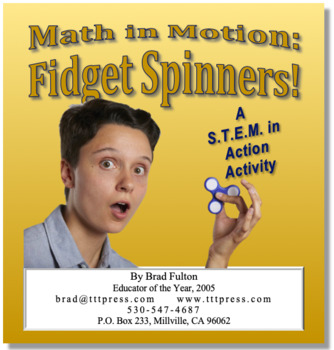
Fidget Spinners: Math in Motion

If a fidget spinner is better at holding a student’s interest than my math lesson, it’s not the fidget spinner than needs to go! Let’s use them to help the students see the math in their everyday life math in a fun and engaging way. Students will gather and interpret data, convert measurements of time, graph data, and even use online software if you wish.As a “S.T.E.M. in Action” lesson, you’ll find all four components of a true S.T.E.M. curriculum represented.Science — Students design an experi
Preview of Get Science Fair Ready! Project Based Learning Data Literacy with Google Slides

Get Science Fair Ready! Project Based Learning Data Literacy with Google Slides

Science fair project that helps you teach data management. Middle school data literacy and research project covers everything middle school students need to know about collecting and interpreting data for their own animal observation observation project. Great for science fairs! Learn about collecting objective, non-bias data and how to recognize it in the real world.Everything is included to have students learn about data, collect data and present a meaningful research project.Students can pers
Showing 1-24 of 36 results

Discover Summer Teaching Resources | TPT

Uncover more about Summer teaching resources

Teach with Summer Printables from TPT

Summer break is finally here, and while students are excited to kick back and relax, teachers may be searching for fun summer activities to keep their students engaged and learning throughout the summer months in June, July, and August. Luckily, there are plenty of fun and educational resources available that can help keep students motivated and inspired, even when the weather is hot and the sun is shining. In this article, we will explore some of the best summer resources and printables for teachers and students, covering a range of subjects and activities to suit all ages and interests. So, whether you're a teacher looking for new ideas, or a student looking for a fun way to keep learning, read on to discover the best summer resources and printables available.

Ideas for Summer Fun & Learning

  1. Summer Reading Lists and Worksheets

One of the best ways to keep students engaged and learning throughout the summer is to encourage them to read. Reading helps to build vocabulary, comprehension, and critical thinking skills, and can be a fun and relaxing way to spend a lazy summer day. To help promote summer reading, TPT offers a variety of summer reading lists and worksheets for students of all ages. These lists typically include a variety of books in different genres and reading levels, along with discussion questions and activities to help students engage with the material.

  1. STEM Activities and Experiments

For students who love science and technology, there are plenty of STEM activities and experiments available that can be done at home or in the classroom. These activities can help students build skills in areas such as coding, robotics, and engineering, while also encouraging creativity and problem-solving. Some popular STEM activities for summer include building and launching rockets, creating homemade ice cream, and designing and building a solar-powered car.

  1. Art Projects and Crafts

Summer is a great time to get creative, and there are plenty of art projects and crafts that students can do to express themselves and build their skills. From painting and drawing to sewing and pottery, there are endless possibilities for creative expression. Some popular summer art projects include creating a nature journal, making a homemade birdhouse, and designing and creating a summer-themed t-shirt.

  1. Virtual Field Trips

While traditional field trips may not be possible during the summer months, virtual field trips offer a fun and educational alternative. Many museums, zoos, and other attractions offer virtual tours and exhibits that allow students to explore and learn about different topics from the comfort of their own homes. Some popular virtual field trips for summer include exploring the Great Barrier Reef, visiting the Louvre Museum in Paris, and taking a tour of the NASA Space Center.

  1. Summer Worksheets and Printables

For students who prefer more structured learning activities, there are plenty of summer worksheets and printables available that cover a range of subjects and topics. These worksheets can help students build skills in areas such as math, science, and language arts, while also providing a fun and engaging way to learn. Some popular summer worksheets and printables include word searches, crossword puzzles, and coloring pages.

  1. Coloring Pages

Other popular resources to explore are summer coloring pages. Easy to print and sure to keep your kids busy, coloring pages are an excellent way for children to express their creativity, unwind, and improve their fine motor skills. Teachers Pay Teachers offers an extensive selection of summer coloring pages featuring beach scenes, road trips, family outings, and more. These printables are suitable for children of all ages and can be a great addition to your summer routine. Your kids will enjoy spending hours coloring these delightful pages and creating their own masterpieces.

Get Started with Summer Resources from TPT

Summer break is a great time for students to relax and recharge, but it's also important to keep their minds active and engaged. With these top summer resources and printables for teachers and students, you can help keep your students motivated and inspired throughout the summer months. Whether you're promoting summer reading, offering STEM activities and experiments, or providing fun and creative art projects and crafts, there are plenty of ways to keep your students learning and growing all summer long. So, try out some of these fun and educational resources and see how they can make this summer your best one yet!

Frequently asked questions:

Are there free summer activities on TPT?

TPT offers many free summer printables as well as resources available for purchase. This includes individual resources as well as resource bundles. Be sure to explore your options and choose resources that fit your budget and needs.

What is an example of a summer printable on TPT?

There are many different types of summer time activities on TPT that are appropriate for little ones as well as for older kids. This includes resources like: Summer Escape Rooms, book report templates, summer reading logs, summer bingo, math-review packets, and many more. Perfect for sunny or rainy days, these activities will keep your students busy in their free time when they aren't playing with friends in the local pool.

How can I make sure my students stay engaged and motivated during the summer months?

Keeping students engaged and motivated when they are not in school can be a challenge, but there are a few things you can do to help. Encouraging summer reading, offering a variety of fun activities and projects, and providing positive feedback and encouragement can all help to keep students motivated and interested in learning throughout the summer.