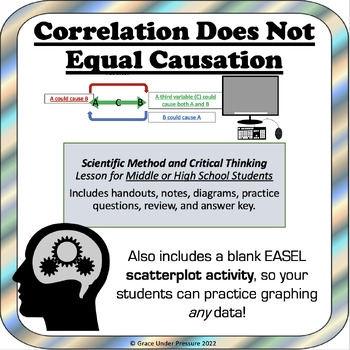
Correlation Does Not Equal Causation: Scientific Method & Critical Thinking
- PDF
- Easel Activity
Description
Scientific Method and Critical Thinking Lesson for Middle or High School Students:
This printable booklet teaches students about correlation, scatterplots, correlation coefficients, third variables, true experiments, independent and dependent variables, random assignment and more in an easy-to-understand and engaging manner.
12 different correlation examples are included.
The package includes handouts, notes, diagrams, practice questions, a review, and an answer key.
I have also included my blank EASEL (virtual) scatterplot activity for free, so your students can practice graphing any data!
Instructions:
Print a 7 page package for each of your students.
Present pages 1-4 on an interactive whiteboard and teach your students the basics of correlation (scatterplots, positive correlation, negative correlation, correlation coefficients, mistaking correlation as causation, media examples, reverse causation, third variables, etc.) as they fill in questions and notes.
Then, students can do the practice questions on their own or in small groups (answer key included).
Next, present page 6 to explain how to actually find causation in a true experiment: random selection, random assignment, dependent variable, independent variable, experimental group, control group, etc.
Finally, students complete a one-page review (answer key included)
Grades to Use With:
This lesson was designed to be accessible to students as young as grade 8 all the way through grade 12. It could be a great addition to a science unit about experimental methods, a science fair unit, a grade 8 math unit about scatter plots, or even a psychology class.


