TPT
Total:
$0.00

Middle School — Lesson 1: Water Resources and Water Footprints

481 Downloads
;
Grade Levels
5th - 8th, Homeschool
Resource Type
Standards
Formats Included
  • PDF
Pages
62 pages

Description

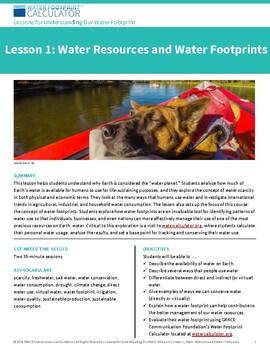
This lesson gives students an in-depth understanding of key water issues. They learn about water resources and water footprints, then use the Water Footprint Calculator to analyze their direct and virtual water consumption. Students get a foundation of knowledge and learn why they should care about protecting water resources, which makes it easier for them to make a fundamental shift in attitude about their water use. Designed for middle school – lower secondary level, ages 11 to 14 – the lessons can be easily adapted to the elementary level.

This free PDF file download includes the complete Lesson 1 with all supplementary material. Included in this download:

Lesson Plan 1

  • Lesson Plan

Supplements

Session 1: How Do We Use Water?

  • Water Resources and Water Footprints Presentation
  • Water Resources and Water Footprints Teacher’s Notes

Session 2: How Do I Use Water?

  • My Water Footprint Stats Student Worksheet
  • My Water Footprint Stats Sample Answers (For Teachers)
  • Basic Rubric
  • Participation Checklist

To download the other two free middle school lesson plans and learn more about “Lessons for Understanding Our Water Footprint,” go to Watercalculator.org:

Lesson 2: My Water Footprint: https://www.watercalculator.org/resource/middle-school-lessons/#MyWaterFootprint

Lesson 3: The Value of a Water Footprint: https://www.watercalculator.org/resource/middle-school-lessons/#ValueWaterFootprint

Standards alignment with the Texas Essential Knowledge and Skills (TEKS); Common Core State Standards (CCSS) for ELA/Literacy and Mathematics; Next Generation Science Standards (NGSS); and the Cloud Education for Sustainability (EFS) Standards & Performance Indicators.

Total Pages
62 pages
Answer Key
Included
Teaching Duration
2 days
Last updated Mar 11th, 2020
Report this resource to TPT
Reported resources will be reviewed by our team. Report this resource to let us know if this resource violates TPT’s content guidelines.

Standards

to see state-specific standards (only available in the US).
Recognize a statistical question as one that anticipates variability in the data related to the question and accounts for it in the answers. For example, “How old am I?” is not a statistical question, but “How old are the students in my school?” is a statistical question because one anticipates variability in students’ ages.
Display numerical data in plots on a number line, including dot plots, histograms, and box plots.
Summarize numerical data sets in relation to their context, such as by:
Informally assess the degree of visual overlap of two numerical data distributions with similar variabilities, measuring the difference between the centers by expressing it as a multiple of a measure of variability. For example, the mean height of players on the basketball team is 10 cm greater than the mean height of players on the soccer team, about twice the variability (mean absolute deviation) on either team; on a dot plot, the separation between the two distributions of heights is noticeable.
Use measures of center and measures of variability for numerical data from random samples to draw informal comparative inferences about two populations. For example, decide whether the words in a chapter of a seventh-grade science book are generally longer than the words in a chapter of a fourth-grade science book.

Reviews

Questions & Answers