1,732 results
High school statistics printables for International Baccalaureate
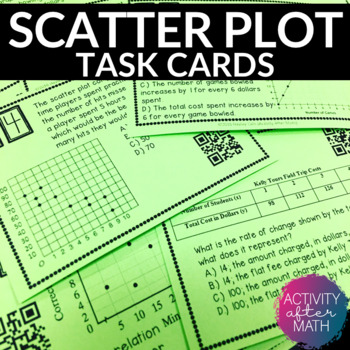
Scatter Plots and Line of Best Fit Task Cards with QR Codes
Get your students involved with practicing Interpreting Data with Scatter Plots and Line of Best Fit! Task cards include multiple choice problems and constructed response. Click here to SAVE and get this as a Task Cards BUNDLEThis resource includes:Teacher InstructionsTeacher TipsStudent Instructions24 Task cards with QR codes24 Task cards without QR codesBlank Answer Document for studentsAnswer Key for easy gradingOptions for using this resource:You can print the ones with QR codes for students
Subjects:
Grades:
8th - 9th
Types:
Also included in: 8th Grade MATH TASK CARDS BUNDLE
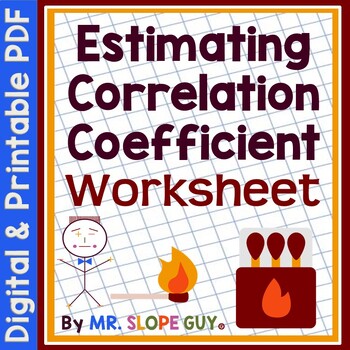
Estimating Correlation Coefficient with Scatter Plots Worksheet
Attention Math Teachers! Are you looking for a way to help your students master estimating correlation? Look no further! Our engaging worksheet is designed to match scatter plots with the correct correlation coefficient. With a variety of reasonable choices, students will estimate the correct r value and interpret positive and negative slope, as well as the strength or weakness of the correlation coefficient of a linear fit.This two-sided worksheet comes with an easy-to-use key and is perfect fo
Subjects:
Grades:
9th
Types:
CCSS:
Also included in: Data and Statistics Worksheets Bundle
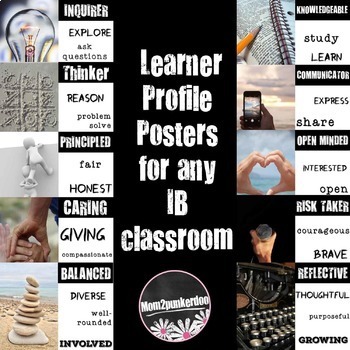
IB Learner Profile Posters for PYP, MYP and DP
Display these posters in your PYP or MYP International Baccalaureate classroom to help convey the IB Learner Profiles.
Includes 10 posters, one for each IB Learner Profile Trait with photos and key words to support the learner profiles.
Inquirer
Knowledgeable
Thinker
Communicator
Principled
Open Minded
Caring
Risk Taker or Courageous
Balanced
Reflective
NOTE: Similar items to support IB can also be purchased in a bundle with many of my International Baccalaureate PYP products at a discounted
Grades:
K - 12th
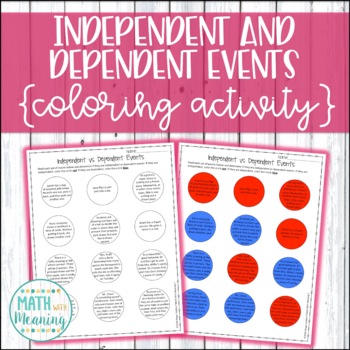
Independent and Dependent Events Coloring Activity - Compound Probability
Take a break from typical worksheets with this coloring activity! Students will read 12 sets of compound events and determine if they are independent or dependent events. Many examples of real-world events are included. This is a great activity for students learning compound probability who struggle with differentiating between independent and dependent events.Two versions of the activity are included: one that asks students to use the colors red and blue for uniformity and easy grading, and one
Subjects:
Grades:
6th - 9th
Types:
CCSS:
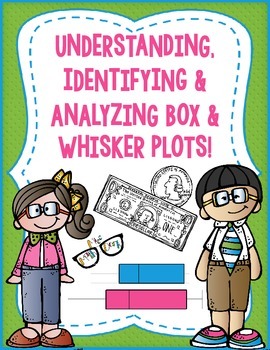
Box and Whisker plots: Understanding, Identifying & Analyzing.
Box and whisker plots pose many problems for students. They often confuse the length of a quartile for the size of data it includes. After seeing my students struggle with this concept for years (even more-so because they had to analyze the data, not merely create the plot) I came up with this activity. The coloring piece, coupled with the dollar bill comparison made something click. I've used the activity ever since! **Please note this activity uses the American Dollar Bill as a portion of a
Subjects:
Grades:
7th - 10th
Types:
AP Statistics Doodle Review Bundle
This Doodle Review Bundle would be great to review for the AP Exam before diving into practice problems. Have students fill in main ideas to help them remember what was taught earlier in the school year! An answer key is included. These Doodle Reviews are based on the chapters of TPS5e and are not aligned to the College Board CED. This Bundle includes the following Doodle Reviews:1 - One Variable Data2 - Density Curves3 - Two Variable Data4 - Designing Studies5 - Probability6 - Random Variables7
Subjects:
Grades:
11th - 12th
Types:
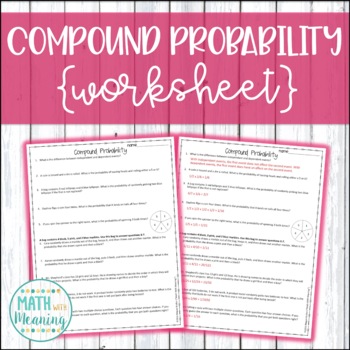
Compound Probability Worksheet - Aligned to CCSS 7.SP.8
This 1-page, 10-question worksheet is a great way for students to practice finding the probability of compound events! It includes both independent and dependent events. Please view the preview file to determine if this product is appropriate for your students!An answer key is included.This activity is aligned to CCSS 7.SP.C.8.Please note that this activity is NOT editable. The text, problems, and images are not able to be changed.**Save money by buying this resource as part of my Compound Proba
Subjects:
Grades:
6th - 9th
Types:
CCSS:
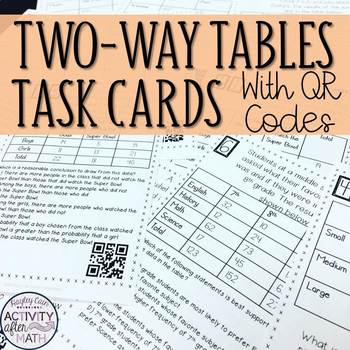
Two-Way Tables (Interpreting Data) Task Cards with QR Codes
Get your students involved with practicing Interpreting Data with Two-Way Tables! This is a great activity that can be used in Math Centers, as individual work, or as a group activity! This gets students moving and also integrates the use of technology into the classroom by scanning QR Codes to check your answer to get immediate feedback!Click here to SAVE and get this as a Task Cards BUNDLEThis resource includes:Teacher InstructionsStudent Instructions20 Task cards with QR codes20 Task cards wi
Subjects:
Grades:
8th - 9th
Types:
CCSS:
Also included in: 8th Grade MATH TASK CARDS BUNDLE
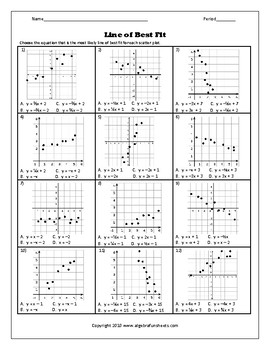
Linear Equations - Scatter Plots and Line of Best Fit Worksheet 2
This is a linear equations scatter plots and line of best fit worksheet.Standard worksheetMultiple choiceNo calculations requiredFrom a scatter plot graph, students will pick the equation that is most likely the line of best fit.This product is included in the Linear and Quadratic Regression Bundle* If you are already an Algebrafunsheets.com subscriber, you already have access to this and over 400+ worksheets. ** Worksheets are copyright material and are intended for use in the classroom only.
Subjects:
Grades:
7th - 11th
Types:
Also included in: Line of Best Fit and Quadratic Regression (Bundle)
Theoretical Probability Color By Number | Math Color By Number
Looking for a fun, rigorous instructional resource for theoretical probability? Why not give coloring pages a try?
This coloring page will aid in student concentration and engagement, plus coloring has proven relaxation and stress relieving benefits. Sometimes students just need a brain break! Students will use their knowledge of probability to learn how to color the accompanying page. This includes some questions where students must apply the theoretical probability to a larger sample size.Ch
Subjects:
Grades:
7th - 9th
Types:
Also included in: Middle School Math Color By Number Growing Bundle
AP Statistics Project Bundle! 6 Projects + digital versions
Looking for some engaging, real-world projects to liven up your AP Statistics course? Need new materials that are ready for remote/ online learning? Want to make sure your AP Statistics course properly prepares student for the AP exam? Look no further - this bundle is for you! In this bundle, you will find four of my popular AP Statistics projects -- all updated to include EDITABLE google docs to assign to students as well as PDFs for printing, if you prefer. All projects also include a complete
Subjects:
Grades:
10th - 12th
Types:
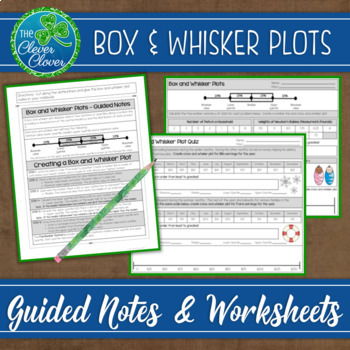
Box and Whisker Plots: Notes, Worksheets and an Assessment
This resource includes detailed step by step notes on how to create a box and whisker plot, a worksheet and an assessment.
The notes include step by step instructions that can be referenced as students study box plots. Students can glue the notes directly into their notebooks. A box and whisker plot visual is used to display the four quartiles of data. As students complete each step, they will determine the five-number summary used to create a box and whisker plot. The guided notes address
Subjects:
Grades:
6th - 9th
Also included in: Statistics Bundle - Guided Notes, Worksheets & Scavenger Hunts!
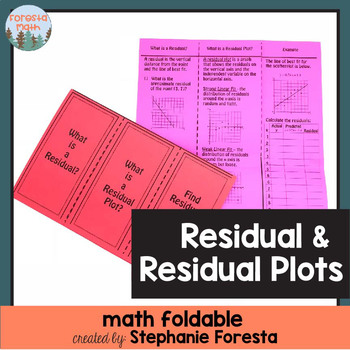
Residual & Residual Plots Foldable
A fun foldable to review or teach residuals and residual plots.
Subjects:
Grades:
7th - 10th
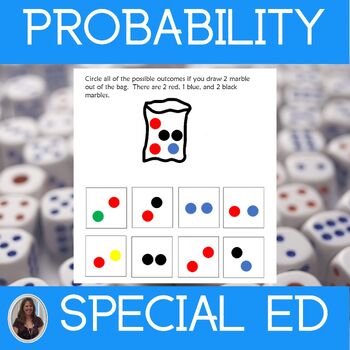
Chance & Probability Math Worksheets Special Education Statistics & Probability
This unit on Chance and Probability contains printable and digital math worksheets for special education. This statistics and probability unit is for students who take alternate assessments.This Chance and Probability unit helps students understand how to determine the probability of an event and all its possible outcomes. The worksheets, which use pictures and color coding, are differentiated. There are many ways for students to practice these skills in this unit that are at different levels.
Subjects:
Grades:
7th - 9th
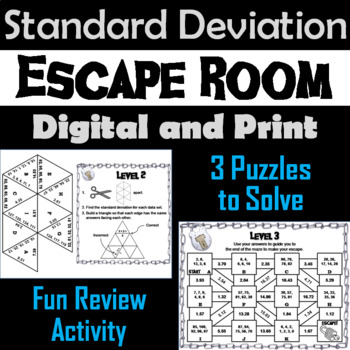
Standard Deviation Activity: Escape Room Algebra Breakout Game (Statistics Unit)
This breakout escape room is a fun way for students to test their skills with calculating standard deviation. Contents: ♦ Teacher Instructions and FAQ ♦ 3 Levels to decode: Multiple Choice, Tarsia Puzzle, and Maze ♦ Student Recording Sheet and Teacher Answer Key ♦ Link to an optional, but recommended, digital breakout roomCheck out the preview and the video preview for more details! - The video preview will show the correct puzzles for this escape
Subjects:
Grades:
8th - 12th
Types:
IB LEARNER PROFILE Posters - English & Spanish
The IB Learner Profile posters have each of the learner profile attributes, along with a brief description of each attribute. Post them on your wall along with your student's name on a clothes pin, clip or removable sticker. This way they can determine with attribute they most exhibit at any particular time!
Also included are 'Today ____ was caught being ______' cards to copy and hand out to students who exhibit a particular attribute.
Subjects:
Grades:
PreK - 12th
Types:
Statistics Curriculum Statistics and Probability Special Ed Math Curriculum
Save $$$ with this Statistics Curriculum. This special ed math curriculum contains 8 units from my series on statistics including statistics and probability. They were developed for students with autism and special learning needs in middle and high school. Each unit is structured in the same way with similar content to enable your students to make connections and build on what they learn in each unit. This repetition of format helps ease anxiety and free up mental space when learning more di
Subjects:
Grades:
8th - 10th
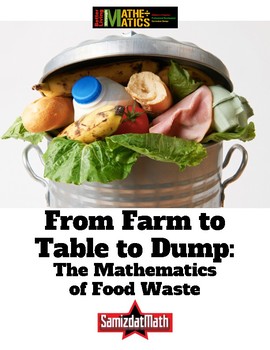
Food Waste and Mathematics: From Farm to Table to Dump
Here's a very uncomfortable fact: it takes 4 pounds of potatoes to make 1 pound of potato chips. That means that for every 1 pound bag of potato chips you eat, 3 pounds of potatoes have to be thrown away. What a waste of food! This is a series of activities that looks at the hidden world of food waste. It includes a look at how much food is wasted as it is "processed" into finished products like french fries and potato chips. It also includes mathematical activities where students calculate how
Subjects:
Grades:
5th - 12th, Adult Education
Types:
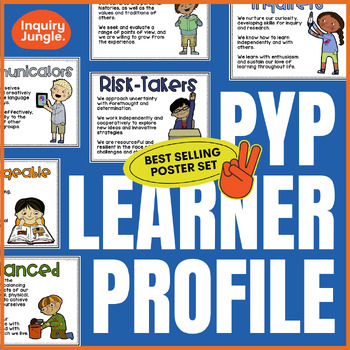
IB Learner Profile • Posters for the PYP, MYP or DP Classroom
Get ready to jazz up your PYP classroom with our popular Learner Profile poster set!These posters beautifully showcase the ten Learner Profile attributes of the PYP in a fun, stylish, and clear way.Psssst! These Learner Profile posters are only the beginning – they're part of our popular PYP Decor Bundle! If you're searching for more than just the LP posters, get ready to explore a delightful collection of additional goodies in the bundle.The Learner Profile Attributes Included in This Pack:Inqu
Grades:
PreK - 12th
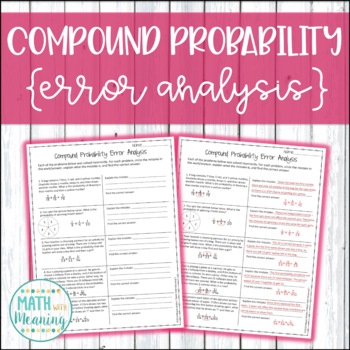
Compound Probability Error Analysis Worksheet Activity - CCSS 7.SP.C.8
Let your students be the teachers and do the grading with this error analysis activity! This worksheet has 5 problems involving the probability of compound events, and each one has been solved incorrectly. Students will identify the error, explain what the error is, and find the correct solution. This is a great way to point out common misconceptions to students! It also helps you to see if they truly understand the concepts while giving them a break from traditional worksheets. An answer key is
Subjects:
Grades:
6th - 9th
Types:
CCSS:
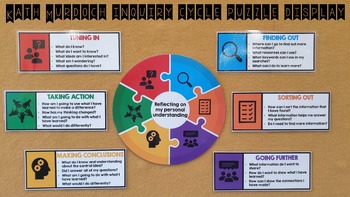
Kath Murdoch inquiry cycle puzzle
The inquiry process doesn't always follow a beautiful straight line. This circular puzzle shows inquiry as an interconnected process rather than a cycle. Each stage is represented with an icon and is elaborated upon on a separate card.This product has been updated: Making conclusions card has been correctedEnsure that you select "FIT" when printing.I printed the circle in A3 and the cards in A4.
Grades:
PreK - 9th
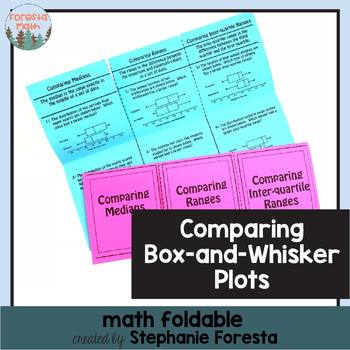
Comparing Box-and-Whisker Plots Math Foldables
A fun foldable to teach or review comparing medians, ranges, and inter-quartile ranges of two box-and-whisker plots.
Subjects:
Grades:
5th - 10th
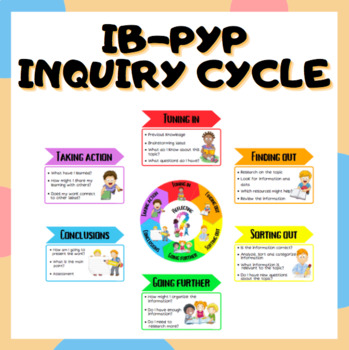
The Inquiry Cycle - PYP - International Baccalaureate
IB-YP Inquiry Cycle wall display:It includes different posters with questions to laminate and assembleTwo different roulettes Poster with all the cycle stepsPoster with every phase of the cycle. It consists of a blank one to write your very own prompts."Reflecting on your learning" poster. High printing quality. From A4 all the way up to A0.
Grades:
PreK - 12th
Types:
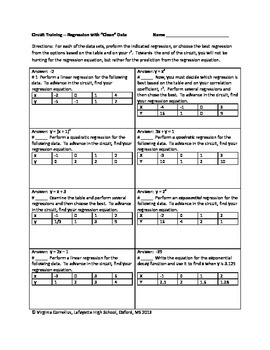
Circuit Training - Linear, Quadratic and Exponential Regression
Give your students engaging practice with the circuit format! Students will need to use technology (graphing calculator, on-line software) to calculate regression equations to advance in the circuit. At first students will be told what kind of regression, but towards the end of the circuit students need to try several regressions and compare the r-value to see which is the best fit. 16 equations total. Can be turned into task cards or even a scavenger hunt.In addition, many of the answers ar
Subjects:
Grades:
8th - 11th, Higher Education
Types:
Showing 1-24 of 1,732 results

