956 results
High school statistics printable pdfs for homeschool
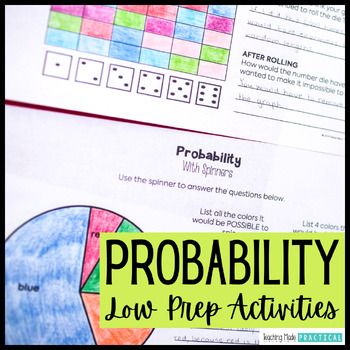
Probability Activities - Fun Review Worksheets, Spinners, Dice, Task Cards
These low prep probability activities and worksheets make a great introduction or review. Students will practice probability vocabulary - certain, impossible, possible, likely, unlikely, and equally likely - and apply these words in a variety of situations and events. Students will also get the opportunity to think about different probability events with hands on practice using spinners, coins, and dice. The fun probability activities include: 6 anchor charts / probability posters to help stu
Subjects:
Grades:
2nd - 5th
Types:
Estimating Correlation Coefficient with Scatter Plots Worksheet
Attention Math Teachers! Are you looking for a way to help your students master estimating correlation? Look no further! Our engaging worksheet is designed to match scatter plots with the correct correlation coefficient. With a variety of reasonable choices, students will estimate the correct r value and interpret positive and negative slope, as well as the strength or weakness of the correlation coefficient of a linear fit.This two-sided worksheet comes with an easy-to-use key and is perfect fo
Subjects:
Grades:
9th
Types:
CCSS:
Also included in: Data and Statistics Worksheets Bundle
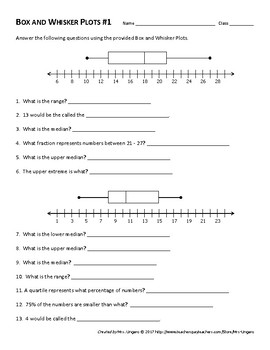
Box and Whisker Plot Worksheets
This product contains TWO Box-and-Whisker Plot worksheets.
Both worksheets requires students to read, interpret, and create Box-and-Whisker plots. Students will first be asked to find lower and upper extremes, range, and all three medians. Following this, students will be creating their own Box-and-Whisker Plots using the information provided.
Worksheet #1 is slightly easier than worksheet #2. This can be used to cover multiple days of instruction or to differentiate within the classroom.
Subjects:
Grades:
5th - 8th
Types:
CCSS:
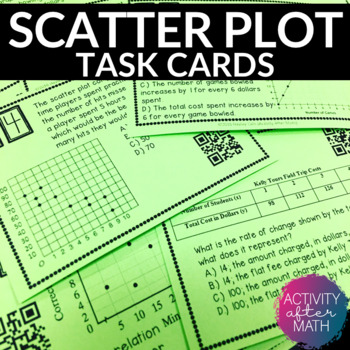
Scatter Plots and Line of Best Fit Task Cards with QR Codes
Get your students involved with practicing Interpreting Data with Scatter Plots and Line of Best Fit! Task cards include multiple choice problems and constructed response. Click here to SAVE and get this as a Task Cards BUNDLEThis resource includes:Teacher InstructionsTeacher TipsStudent Instructions24 Task cards with QR codes24 Task cards without QR codesBlank Answer Document for studentsAnswer Key for easy gradingOptions for using this resource:You can print the ones with QR codes for students
Subjects:
Grades:
8th - 9th
Types:
Also included in: 8th Grade MATH TASK CARDS BUNDLE
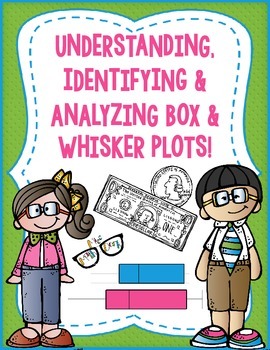
Box and Whisker plots: Understanding, Identifying & Analyzing.
Box and whisker plots pose many problems for students. They often confuse the length of a quartile for the size of data it includes. After seeing my students struggle with this concept for years (even more-so because they had to analyze the data, not merely create the plot) I came up with this activity. The coloring piece, coupled with the dollar bill comparison made something click. I've used the activity ever since! **Please note this activity uses the American Dollar Bill as a portion of a
Subjects:
Grades:
7th - 10th
Types:
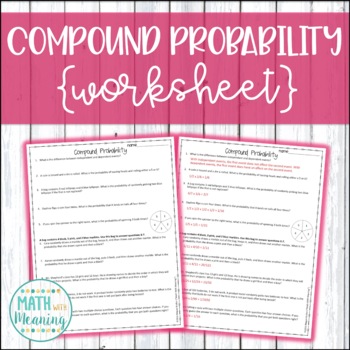
Compound Probability Worksheet - Aligned to CCSS 7.SP.8
This 1-page, 10-question worksheet is a great way for students to practice finding the probability of compound events! It includes both independent and dependent events. Please view the preview file to determine if this product is appropriate for your students!An answer key is included.This activity is aligned to CCSS 7.SP.C.8.Please note that this activity is NOT editable. The text, problems, and images are not able to be changed.**Save money by buying this resource as part of my Compound Proba
Subjects:
Grades:
6th - 9th
Types:
CCSS:
CHANCE AND PROBABILITY (FOUNDATION TO YEAR 2 ACTIVITY PACK)
This activity pack includes a variety of activities for you to use when teaching chance and probability using the language of will happen, might happen, will not happen and likely, unlikely and impossible. The resources include:Chance booklet where students cut along the dotted lines and draw and write about an event that will happen, might happen, will not happen (Or likely, unlikely, impossible). There are 7 font options and 1 with dotted thirds and one plain without lines to select from. What
Subjects:
Grades:
PreK - 4th
Types:
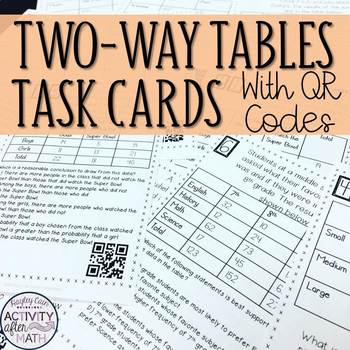
Two-Way Tables (Interpreting Data) Task Cards with QR Codes
Get your students involved with practicing Interpreting Data with Two-Way Tables! This is a great activity that can be used in Math Centers, as individual work, or as a group activity! This gets students moving and also integrates the use of technology into the classroom by scanning QR Codes to check your answer to get immediate feedback!Click here to SAVE and get this as a Task Cards BUNDLEThis resource includes:Teacher InstructionsStudent Instructions20 Task cards with QR codes20 Task cards wi
Subjects:
Grades:
8th - 9th
Types:
CCSS:
Also included in: 8th Grade MATH TASK CARDS BUNDLE
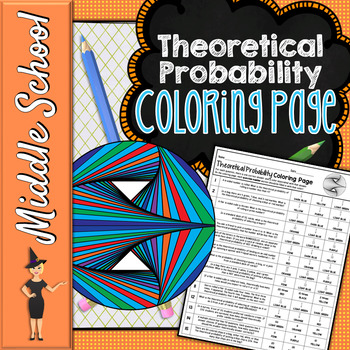
Theoretical Probability Color By Number | Math Color By Number
Looking for a fun, rigorous instructional resource for theoretical probability? Why not give coloring pages a try?
This coloring page will aid in student concentration and engagement, plus coloring has proven relaxation and stress relieving benefits. Sometimes students just need a brain break! Students will use their knowledge of probability to learn how to color the accompanying page. This includes some questions where students must apply the theoretical probability to a larger sample size.Ch
Subjects:
Grades:
7th - 9th
Types:
Also included in: Middle School Math Color By Number Growing Bundle
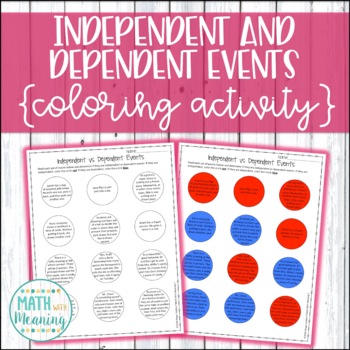
Independent and Dependent Events Coloring Activity - Compound Probability
Take a break from typical worksheets with this coloring activity! Students will read 12 sets of compound events and determine if they are independent or dependent events. Many examples of real-world events are included. This is a great activity for students learning compound probability who struggle with differentiating between independent and dependent events.Two versions of the activity are included: one that asks students to use the colors red and blue for uniformity and easy grading, and one
Subjects:
Grades:
6th - 9th
Types:
CCSS:
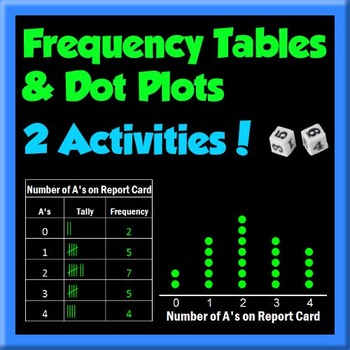
Frequency Tables and Dot Plots - 2 activities
With your purchase, you're receiving 2 frequency table and dot plot/line plot activities. Be sure to check out the preview to view all 5 pages.
The first activity moves your students through the steps of creating frequency tables and dot plots. First, they have to match the correct dot plot to the given frequency table, and explain the errors in the other plots. Next, students have to finish the dot plots, given the frequency tables. Finally, students have to create both the frequency table
Subjects:
Grades:
5th - 7th
Types:
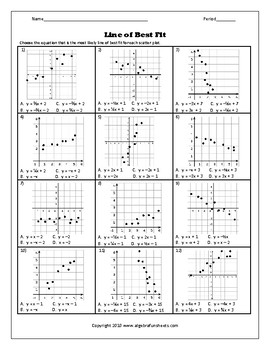
Linear Equations - Scatter Plots and Line of Best Fit Worksheet 2
This is a linear equations scatter plots and line of best fit worksheet.Standard worksheetMultiple choiceNo calculations requiredFrom a scatter plot graph, students will pick the equation that is most likely the line of best fit.This product is included in the Linear and Quadratic Regression Bundle* If you are already an Algebrafunsheets.com subscriber, you already have access to this and over 400+ worksheets. ** Worksheets are copyright material and are intended for use in the classroom only.
Subjects:
Grades:
7th - 11th
Types:
Also included in: Line of Best Fit and Quadratic Regression (Bundle)
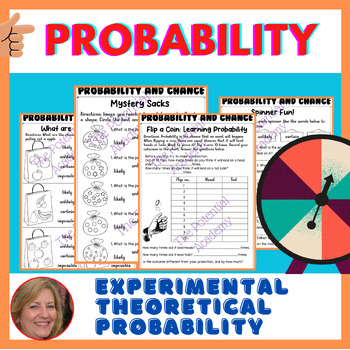
Chance and Probability, Theoretical & Experimental Probability Activities
Do your children have trouble determining the likelihood of events and situations? Then this Probability and Chance package is for you! This set is packed with full worksheets and activities to teach your children all about Probability & Chance.There is a set of questions about Probability and Chance for a student to get to know the concept of Probability through the language of change: likely, unlikely, certain, impossible, more likely, less likely, and equally likely, certain, likely, unli
Subjects:
Grades:
5th - 7th
Types:
Also included in: (BUNDLE) Chance and Probability worksheets & Area and Perimeter 3rd math
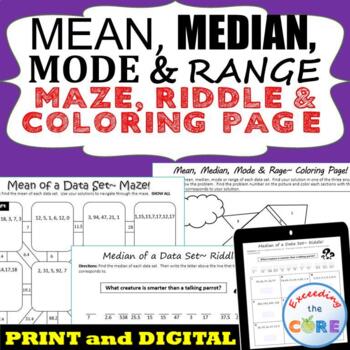
MEAN, MEDIAN, MODE, & RANGE Mazes, Riddles & Coloring Page | Print and Digital
Have your students apply their understanding of finding the MEAN, MEDIAN, MODE, & RANGE of data sets with these fun activities including a maze, riddle and coloring activity. What is Included:1. Finding the Mean MAZEThis is a self-checking worksheet that allows students to strengthen their understanding of finding the mean of positive whole numbers. Students use their answers to navigate through the puzzle.2. Finding the Median RIDDLEStudents find the median of positive whole numbers and use
Subjects:
Grades:
5th - 7th
Types:
Also included in: 6th Grade Math Assessments, Notes, Task Cards, Worksheets BUNDLE
Histogram Hike - Google Slides and PDF Versions
Want to make histograms fun and keep your student active?Just cut out these 14 histograms/data tables, and post them around the perimeter of your classroom. Place one or two students at each station. Your students will read the question, interpret the data display, and record their answers next to the corresponding number on their papers. And now, your purchase also includes a Google Slides version for Distance Learning! You will need a Google account to access this version.There is also a k
Subjects:
Grades:
5th - 7th
Types:
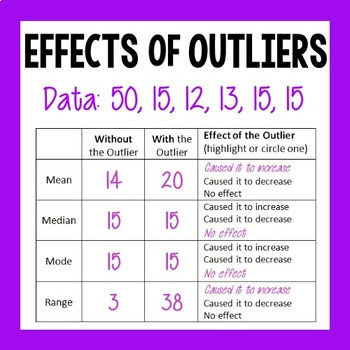
Effects of Outliers - NOW WITH DISTANCE LEARNING GOOGLE SLIDES!
How does an outlier affect the mean, median, mode, or range? Does it always have an effect? What predictions can you make about how the outlier will affect these measures?These 6 quick and easy tables will help you students make generalizations (such as a larger outlier will always increase the mean). And now this product also includes a Google Slides version, compatible with Google Classroom for Distance Learning! You will receive a 2-page student PDF version, and an answer key. And you wil
Subjects:
Grades:
5th - 6th
Types:
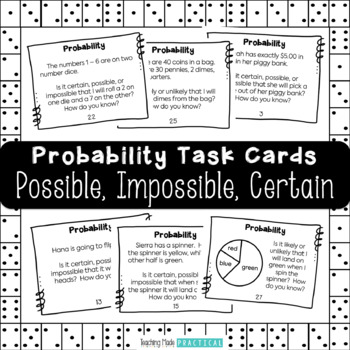
32 Probability Task Cards - Certain, Possible, Impossible, Likely, Unlikely
These 32 probability task cards are for helping students practice considering what probability events are certain, possible, impossible, unlikely, and likely. Students will read a short scenario, usually involving rolling a number die, spinning spinner, flipping a coin, or drawing marbles or counters out of a bag. Then, students are asked whether a certain event is certain / possible / impossible, or likely / unlikely. The majority of the task cards (24) focus on certain, possible, and imposs
Subjects:
Grades:
2nd - 4th
Types:
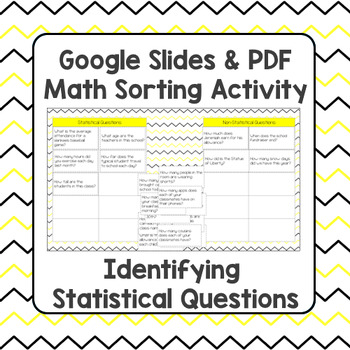
Statistical Question Sort - Digital Google Slides and PDF Versions
Students need to find measures of center and variability, and display data in a variety of ways.This all starts with identifying and asking statistical questions! You will receive 2 versions of this activity: 1 PDF and key, and 1 link to a Google Slides version for Distance Learning! You need a Google account to access the digital version. You can In this sorting activity, students cut out 20 question cards to sort manually, or they drag and drop cards in the digital version to sort in a Goog
Subjects:
Grades:
6th
Types:
CCSS:
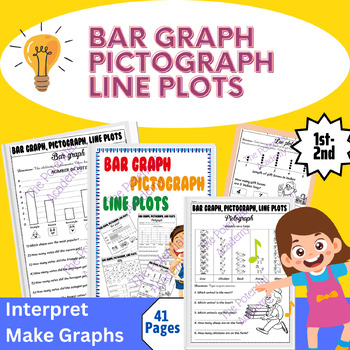
Bar Graphs, Pictographs, Line Plots, Tally Graph worksheet - Types of graph
Are you looking for a mix of no-prep activities for bar graphs, pictographs, and line plots? This Bar Graph, Pictograph, Tally, and Line Plots pack includes a variety of exercises for practicing reading graphs, showing data, and analyzing data on bar graphs, pictographs, and line plots in no time!The two main activities, reading graphs and drawing graphs, were designed with different practices to enhance their understanding of working with bar graphs, pictographs, tally, and line plots. There ar
Subjects:
Grades:
1st - 2nd
Types:
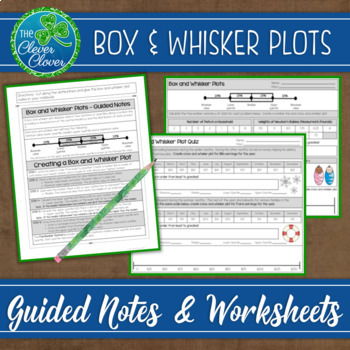
Box and Whisker Plots: Notes, Worksheets and an Assessment
This resource includes detailed step by step notes on how to create a box and whisker plot, a worksheet and an assessment.
The notes include step by step instructions that can be referenced as students study box plots. Students can glue the notes directly into their notebooks. A box and whisker plot visual is used to display the four quartiles of data. As students complete each step, they will determine the five-number summary used to create a box and whisker plot. The guided notes address
Subjects:
Grades:
6th - 9th
Also included in: Statistics Bundle - Guided Notes, Worksheets & Scavenger Hunts!
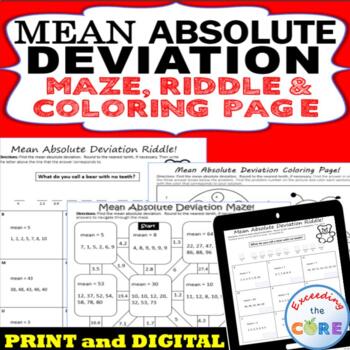
MEAN ABSOLUTE DEVIATION Mazes, Riddles & Coloring Page | Print and Digital
Have your students apply their understanding MEAN ABSOLUTE DEVIATION with these fun activities including a maze, riddle and coloring activity.What's Included:1. Mean Absolute Deviation MAZEThis is a self-checking worksheet that allows students to strengthen their understanding of finding the mean absolute deviation. Students use their answers to navigate through the puzzle.2. Mean Absolute Deviation RIDDLEStudents find the mean absolute deviation of various data sets. Students use their answer
Subjects:
Grades:
5th - 7th
Types:
Also included in: 6th Grade Math Assessments, Notes, Task Cards, Worksheets BUNDLE
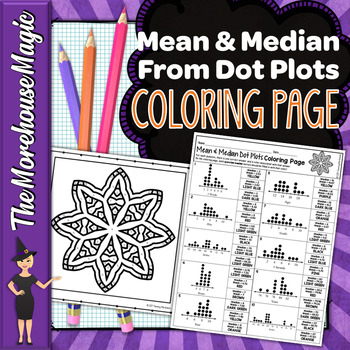
Mean & Median from Dot Plots Color by Number | Math Color By Number
This Mean & Median from Dot Plots Common Core Math Color By Number includes 10 questions in which students will find the mean and median of a data set given a dot plot diagram.With what standard does this resource align?This resource will aid students in moving towards mastery of CCSS 6.SP.B.5 and 6.SP.B.5.C.What do I have to do?These color by numbers are no prep! Print the answer sheet on one side and the coloring on the other or print both on one side to save ink and copier counts.How do I
Subjects:
Grades:
5th - 7th
Types:
Also included in: Middle School Math Color By Number Growing Bundle
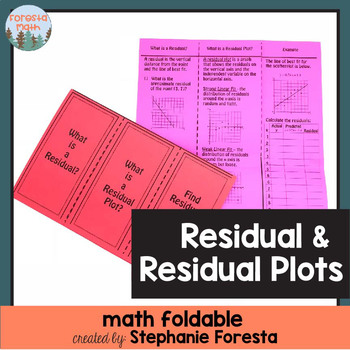
Residual & Residual Plots Foldable
A fun foldable to review or teach residuals and residual plots.
Subjects:
Grades:
7th - 10th
Math Color by Number - Histograms - Fun!
I'm making it my mission to take some of the most irrelevant, abstract concepts for students, and turning them into FUN color-by-number activities. Why should these fun coloring activities stop once kids leave elementary school? Watch your students actually care about their answers as they quietly work to color each picture correctly. You can assess their progress quickly, just by glancing to see if they colored their pictures correctly.The directions for students are as follows: Complete the pr
Subjects:
Grades:
6th
Types:
Showing 1-24 of 956 results


