17 results
10th grade statistics printables for Easel Activities
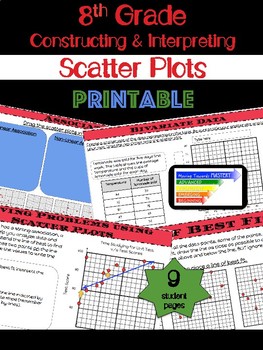
8th Grade Math Constructing & Interpreting Scatter Plots
Extensive printable lessons for constructing and interpreting scatter plots.The lessons are scaffolded to build understanding. Students will progress from identification of terms to making predictions involving bivariate data. The guided lessons will begin with identification, move towards assisted analysis, and conclude with independent practice.Lessons include...♦ Definitions and Visual Representations♦ Identification and Use of Terms → Bivariate Data → Scatter Plot → Linear, Nonli
Subjects:
Grades:
8th - 10th
Types:
CCSS:
Also included in: 8th Grade Math Common Core Growing Bundle
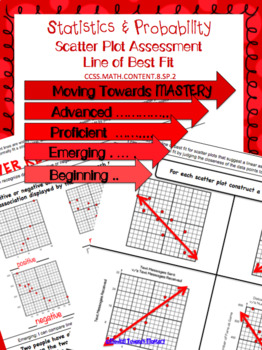
8.SP.2 Scatter Plots: Line of Best Fit Assessment
Assessment for Scatter Plots: Line of Best Fit that measures understanding at various levels of mastery to identify at what level students have progressed. Levels of mastery are:→ Beginning → Emerging→ Proficient→ AdvancedEASY printing with answer key--------------------------------------------------------------------------------------------------------------------------------------------------------------These printable worksheets can also be used as digital resources through the TpT Digital Ac
Subjects:
Grades:
8th - 10th
Types:
CCSS:
Also included in: 8th Grade Common Core Statistics & Probability Assessments
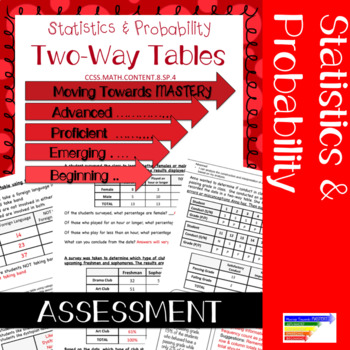
Two Way Frequency Tables Printable Test 8.SP.4 Assessment
Assessment for Two Way Frequency Tables - This printable test will measure understanding at various levels of mastery to identify at what level students have progressed. Levels of mastery are:→ Beginning → Emerging→ Proficient→ AdvancedEASY printing with answer keyCheck out resources for teaching Scatter Plots:Scatter Plot Interactive Google SlidesScatter Plot ProjectScatter Plot PRINTABLECheck out the levels of mastery tool created to introduce the standard in my store:Scatter Plot Levels of Ma
Subjects:
Grades:
8th - 10th
Types:
CCSS:
Also included in: 8th Grade Common Core Statistics & Probability Assessments
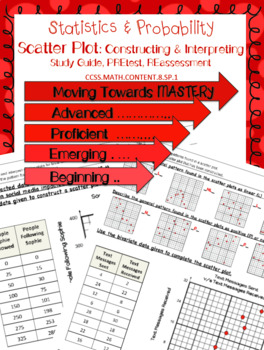
8.SP.1 Construct & Interpret Scatter Plots Pre-test/ Study Guide/ Reassessment
This resource would be useful in the following ways:→ Pre-test before introducing the standard→ Study Guide to prepare for the assessment→ Reassessment This resource will allow you to measure student understanding of how to construct and interpret a scatter plot at various levels of mastery to identify at what level students are prior to instruction or after instruction. Levels of mastery are:→ Beginning → Emerging→ Proficient→ AdvancedEASY printing with answer key-------------------------------
Subjects:
Grades:
8th - 10th
CCSS:
Also included in: 8th Grade Common Core Statistics & Probability Assessments
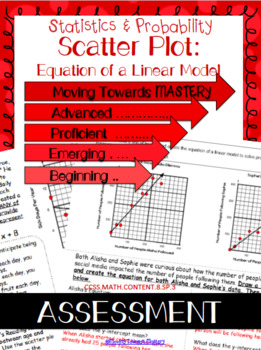
8.SP.3 Scatter Plots: Equation of a Linear Model Assessment
Assessment for Scatter Plots: Equation of a Linear Model that measures understanding at various levels of mastery to identify at what level students have progressed. Levels of mastery are:→ Beginning → Emerging→ Proficient→ AdvancedEASY printing with answer key--------------------------------------------------------------------------------------------------------------------------------------------------------------These printable worksheets can also be used as digital resources through the TpT
Subjects:
Grades:
8th - 10th
Types:
CCSS:
Also included in: 8th Grade Common Core Statistics & Probability Assessments
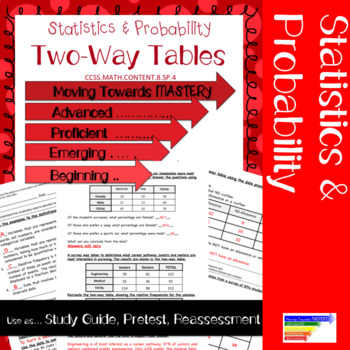
Two Way Frequency Tables Activity 8.SP.4 Pre Test, Study Guide, or Reassessment
The Two Way Frequency Tables Activity is great for a pre test before introducing the standard, study guide to prepare for an assessment, or as a reassessment. This resource will allow you to measure student understanding of two way frequency tables at various levels of mastery to identify at what level students are prior to instruction or after instruction. Levels of mastery are:→ Beginning → Emerging→ Proficient→ AdvancedEASY printing with answer keyNeed the TEST for this standard? Click the ti
Subjects:
Grades:
8th - 10th
CCSS:
Also included in: 8th Grade Common Core Statistics & Probability Assessments
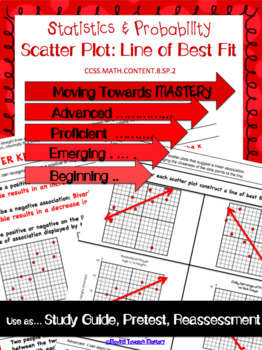
8.SP.2 Scatter Plots: Line of Best Fit Pre-test/ Study Guide/ Reassessment
This resource would be useful in the following ways:→ Pre-test before introducing the standard→ Study Guide to prepare for the assessment→ Reassessment This resource will allow you to measure student understanding of how to construct a line of best fit on a scatter plot at various levels of mastery to identify at what level students are prior to instruction or after instruction. Levels of mastery are:→ Beginning → Emerging→ Proficient→ AdvancedEASY printing with answer key-----------------------
Subjects:
Grades:
8th - 10th
CCSS:
Also included in: 8th Grade Common Core Statistics & Probability Assessments
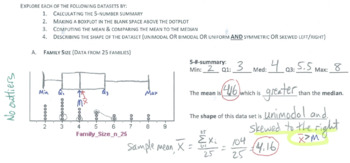
Statistics and Data Analysis: 5-number summary, box plots, and outliers
An introduction to data analysis, this 2-page handout (with answer KEY!) provides 6 datasets to analyze. Students compute the 5-number summary, make a box plot, describe the shape of a data set and relate the shape to the mean/median relationship, then finally go back through and check for outliers.
Subjects:
Grades:
9th - 12th
Types:
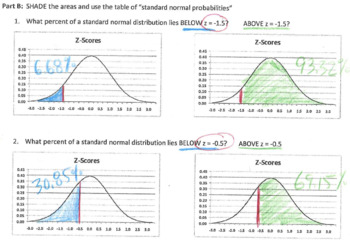
Statistics sketches: Z-scores and percentiles
Students will make a connection between z-scores and percentiles by shading the area under a bell curve (actually, 10 areas under 10 bell curves!). Finally, students will create a box plot under a standard normal distribution in order to make a strong connection between the unimodal symmetric normal distribution and its box plot.
Subjects:
Grades:
9th - 12th
Types:
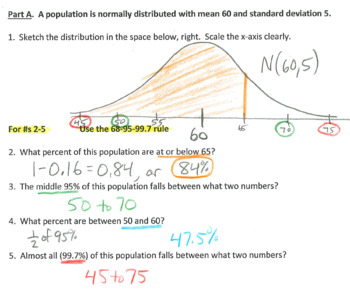
Statistics Quiz: the normal distribution
One practice quiz (with answer KEY!) and two forms of a "real quiz" (answer KEYs provided!) on the normal distribution. Students must sketch and label a bell curve, use the 68-95-99.7 rule, compute z-scores and use a z-table (commonly referred to as "Table A").
Subjects:
Grades:
9th - 12th
Types:
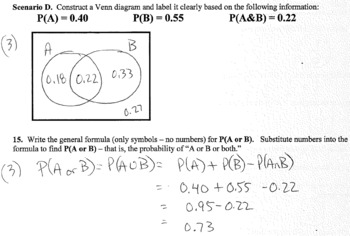
Statistics Quiz: Basic Probability (two versions)
Two versions of a quiz on basic probability concepts (answer KEYS provided). One quiz could be used as a practice/review. Includes sample space, independent events, mutually exclusive events, Venn diagrams, and the complement rule.
Subjects:
Grades:
9th - 12th
Types:
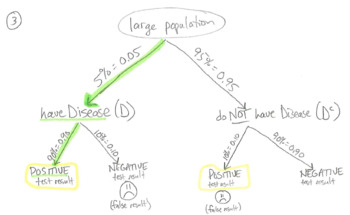
Probability Practice Packet (5 parts)
5-part probability practice packet (with answer KEY!). Students will practice the "rules and tools" of probability, to include the sample space, Venn diagrams, substitution into formulas, two-way tables, conditional probability, and tree diagrams.
Subjects:
Grades:
9th - 12th
Types:
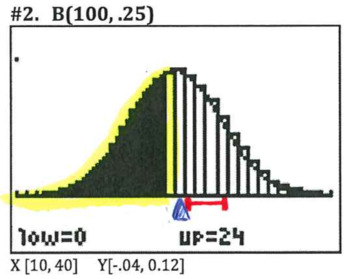
Statistics practice: Binomial Distributions & the Normal Distribution
Students will work through several binomial distributions in order to recognize when the binomial distribution can be approximated by the normal distribution. Examples and answer key include graphs to provide visual support.
Subjects:
Grades:
9th - 12th
Types:
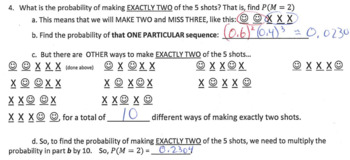
Statistics notes: Intro to the Binomial Distribution (w/practice problems)
Lead students through a clear, visually reinforced example to introduce the binomial formula, then practice solving problems using the binomial distribution. Answer KEY included.
Subjects:
Grades:
9th - 12th
Types:
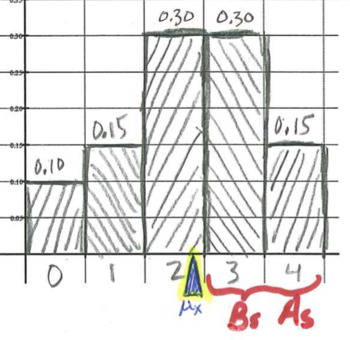
Statistics practice: Random Variables
Students work through the computation of the mean and variance of discrete random variables with reference to the probability histograms. After introductory examples, students work through several practice problems. Answer KEY provided!
Subjects:
Grades:
9th - 12th
Types:
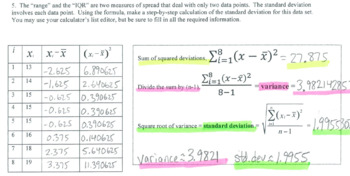
Standard Deviation & Resistant Statistics
By completing this two-page handout (answer KEY provided!), students work through the step-by-step process of calculating the standard deviation for two small datasets. In the process, students will note which statistics are resistant to outliers.
Subjects:
Grades:
9th - 12th
Types:
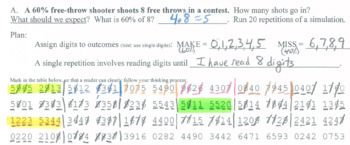
Simulation practice (preview of statistical significance)
Simulations can be challenging, but they can also help reinforce the concept of statistical significance. In this activity, students work through four simulations using random digits printed on the handout. Work through one or two together in class, assign the rest as homework. Answer KEY provided!
Subjects:
Grades:
9th - 12th
Types:
Showing 1-17 of 17 results


